issues
36 rows where user = 14314623 sorted by updated_at descending
This data as json, CSV (advanced)
Suggested facets: comments, closed_at, created_at (date), updated_at (date), closed_at (date)
| id | node_id | number | title | user | state | locked | assignee | milestone | comments | created_at | updated_at ▲ | closed_at | author_association | active_lock_reason | draft | pull_request | body | reactions | performed_via_github_app | state_reason | repo | type |
|---|---|---|---|---|---|---|---|---|---|---|---|---|---|---|---|---|---|---|---|---|---|---|
| 977544678 | MDU6SXNzdWU5Nzc1NDQ2Nzg= | 5733 | Shoudn't `assert_allclose` transpose datasets? | jbusecke 14314623 | open | 0 | 16 | 2021-08-23T22:55:12Z | 2024-05-01T15:27:21Z | CONTRIBUTOR | I am trying to compare two datasets, one of which has possibly transposed dimensions on a data variable.
```AssertionError Traceback (most recent call last) <ipython-input-7-58cd53174a1e> in <module> ----> 1 xr.testing.assert_allclose(ds1, ds2) /srv/conda/envs/notebook/lib/python3.8/site-packages/xarray/testing.py in assert_allclose(a, b, rtol, atol, decode_bytes) 169 a.variables, b.variables, compat=compat_variable 170 ) --> 171 assert allclose, formatting.diff_dataset_repr(a, b, compat=equiv) 172 else: 173 raise TypeError("{} not supported by assertion comparison".format(type(a))) AssertionError: Left and right Dataset objects are not close Differing data variables: L data (x, y) float64 0.8589 0.09264 0.0264 ... 0.1039 0.3685 0.3983 R data (y, x) float64 0.8589 0.8792 0.8433 0.6952 ... 0.3664 0.2214 0.3983 ``` Simply transposing
Since most of the other xarray operations are 'transpose-safe' ( Environment: Output of <tt>xr.show_versions()</tt>INSTALLED VERSIONS ------------------ commit: None python: 3.8.8 | packaged by conda-forge | (default, Feb 20 2021, 16:22:27) [GCC 9.3.0] python-bits: 64 OS: Linux OS-release: 5.4.109+ machine: x86_64 processor: x86_64 byteorder: little LC_ALL: C.UTF-8 LANG: C.UTF-8 LOCALE: ('en_US', 'UTF-8') libhdf5: 1.10.6 libnetcdf: 4.7.4 xarray: 0.19.0 pandas: 1.2.4 numpy: 1.20.2 scipy: 1.6.2 netCDF4: 1.5.6 pydap: installed h5netcdf: 0.11.0 h5py: 3.2.1 Nio: None zarr: 2.7.1 cftime: 1.4.1 nc_time_axis: 1.2.0 PseudoNetCDF: None rasterio: 1.2.2 cfgrib: 0.9.9.0 iris: None bottleneck: 1.3.2 dask: 2021.04.1 distributed: 2021.04.1 matplotlib: 3.4.1 cartopy: 0.19.0 seaborn: None numbagg: None pint: 0.17 setuptools: 49.6.0.post20210108 pip: 20.3.4 conda: None pytest: None IPython: 7.22.0 sphinx: None |
{
    "url": "https://api.github.com/repos/pydata/xarray/issues/5733/reactions",
    "total_count": 0,
    "+1": 0,
    "-1": 0,
    "laugh": 0,
    "hooray": 0,
    "confused": 0,
    "heart": 0,
    "rocket": 0,
    "eyes": 0
} |
xarray 13221727 | issue | ||||||||
| 1755610168 | I_kwDOAMm_X85opHw4 | 7918 | xarray lazy indexing/loading is not sufficiently documented | jbusecke 14314623 | open | 0 | 1 | 2023-06-13T20:35:38Z | 2023-06-13T21:29:53Z | CONTRIBUTOR | What is your issue?The default behavior of opening up datasets lazily instead of loading them into memory urgently needs more documentation or more extensive linking of existing docs. I have seen tons of example where the 'laziness' of the loading is not apparent to users. The workflow commonly looks something like this:
1. Open some 'larger-than-memory' dataset, e.g. from a cloud bucket with To start with, the docstring of Up until a chat I had with @TomNicholas today, I honestly did not understand why this feature even existed. His explanation (below) was however very good, and if something similar is not in the docs yet, should probably be added.
I think overall this is a giant pitfall, particularly for xarray beginners, and thus deserves some thought. While I am sure the choices made up to here might have some large functional upsides, I wonder three things:
Happy to work on this, since it is very relevant for many members of projects I work with. I first wanted to check if there is some existing docs that I missed. |
{
    "url": "https://api.github.com/repos/pydata/xarray/issues/7918/reactions",
    "total_count": 0,
    "+1": 0,
    "-1": 0,
    "laugh": 0,
    "hooray": 0,
    "confused": 0,
    "heart": 0,
    "rocket": 0,
    "eyes": 0
} |
xarray 13221727 | issue | ||||||||
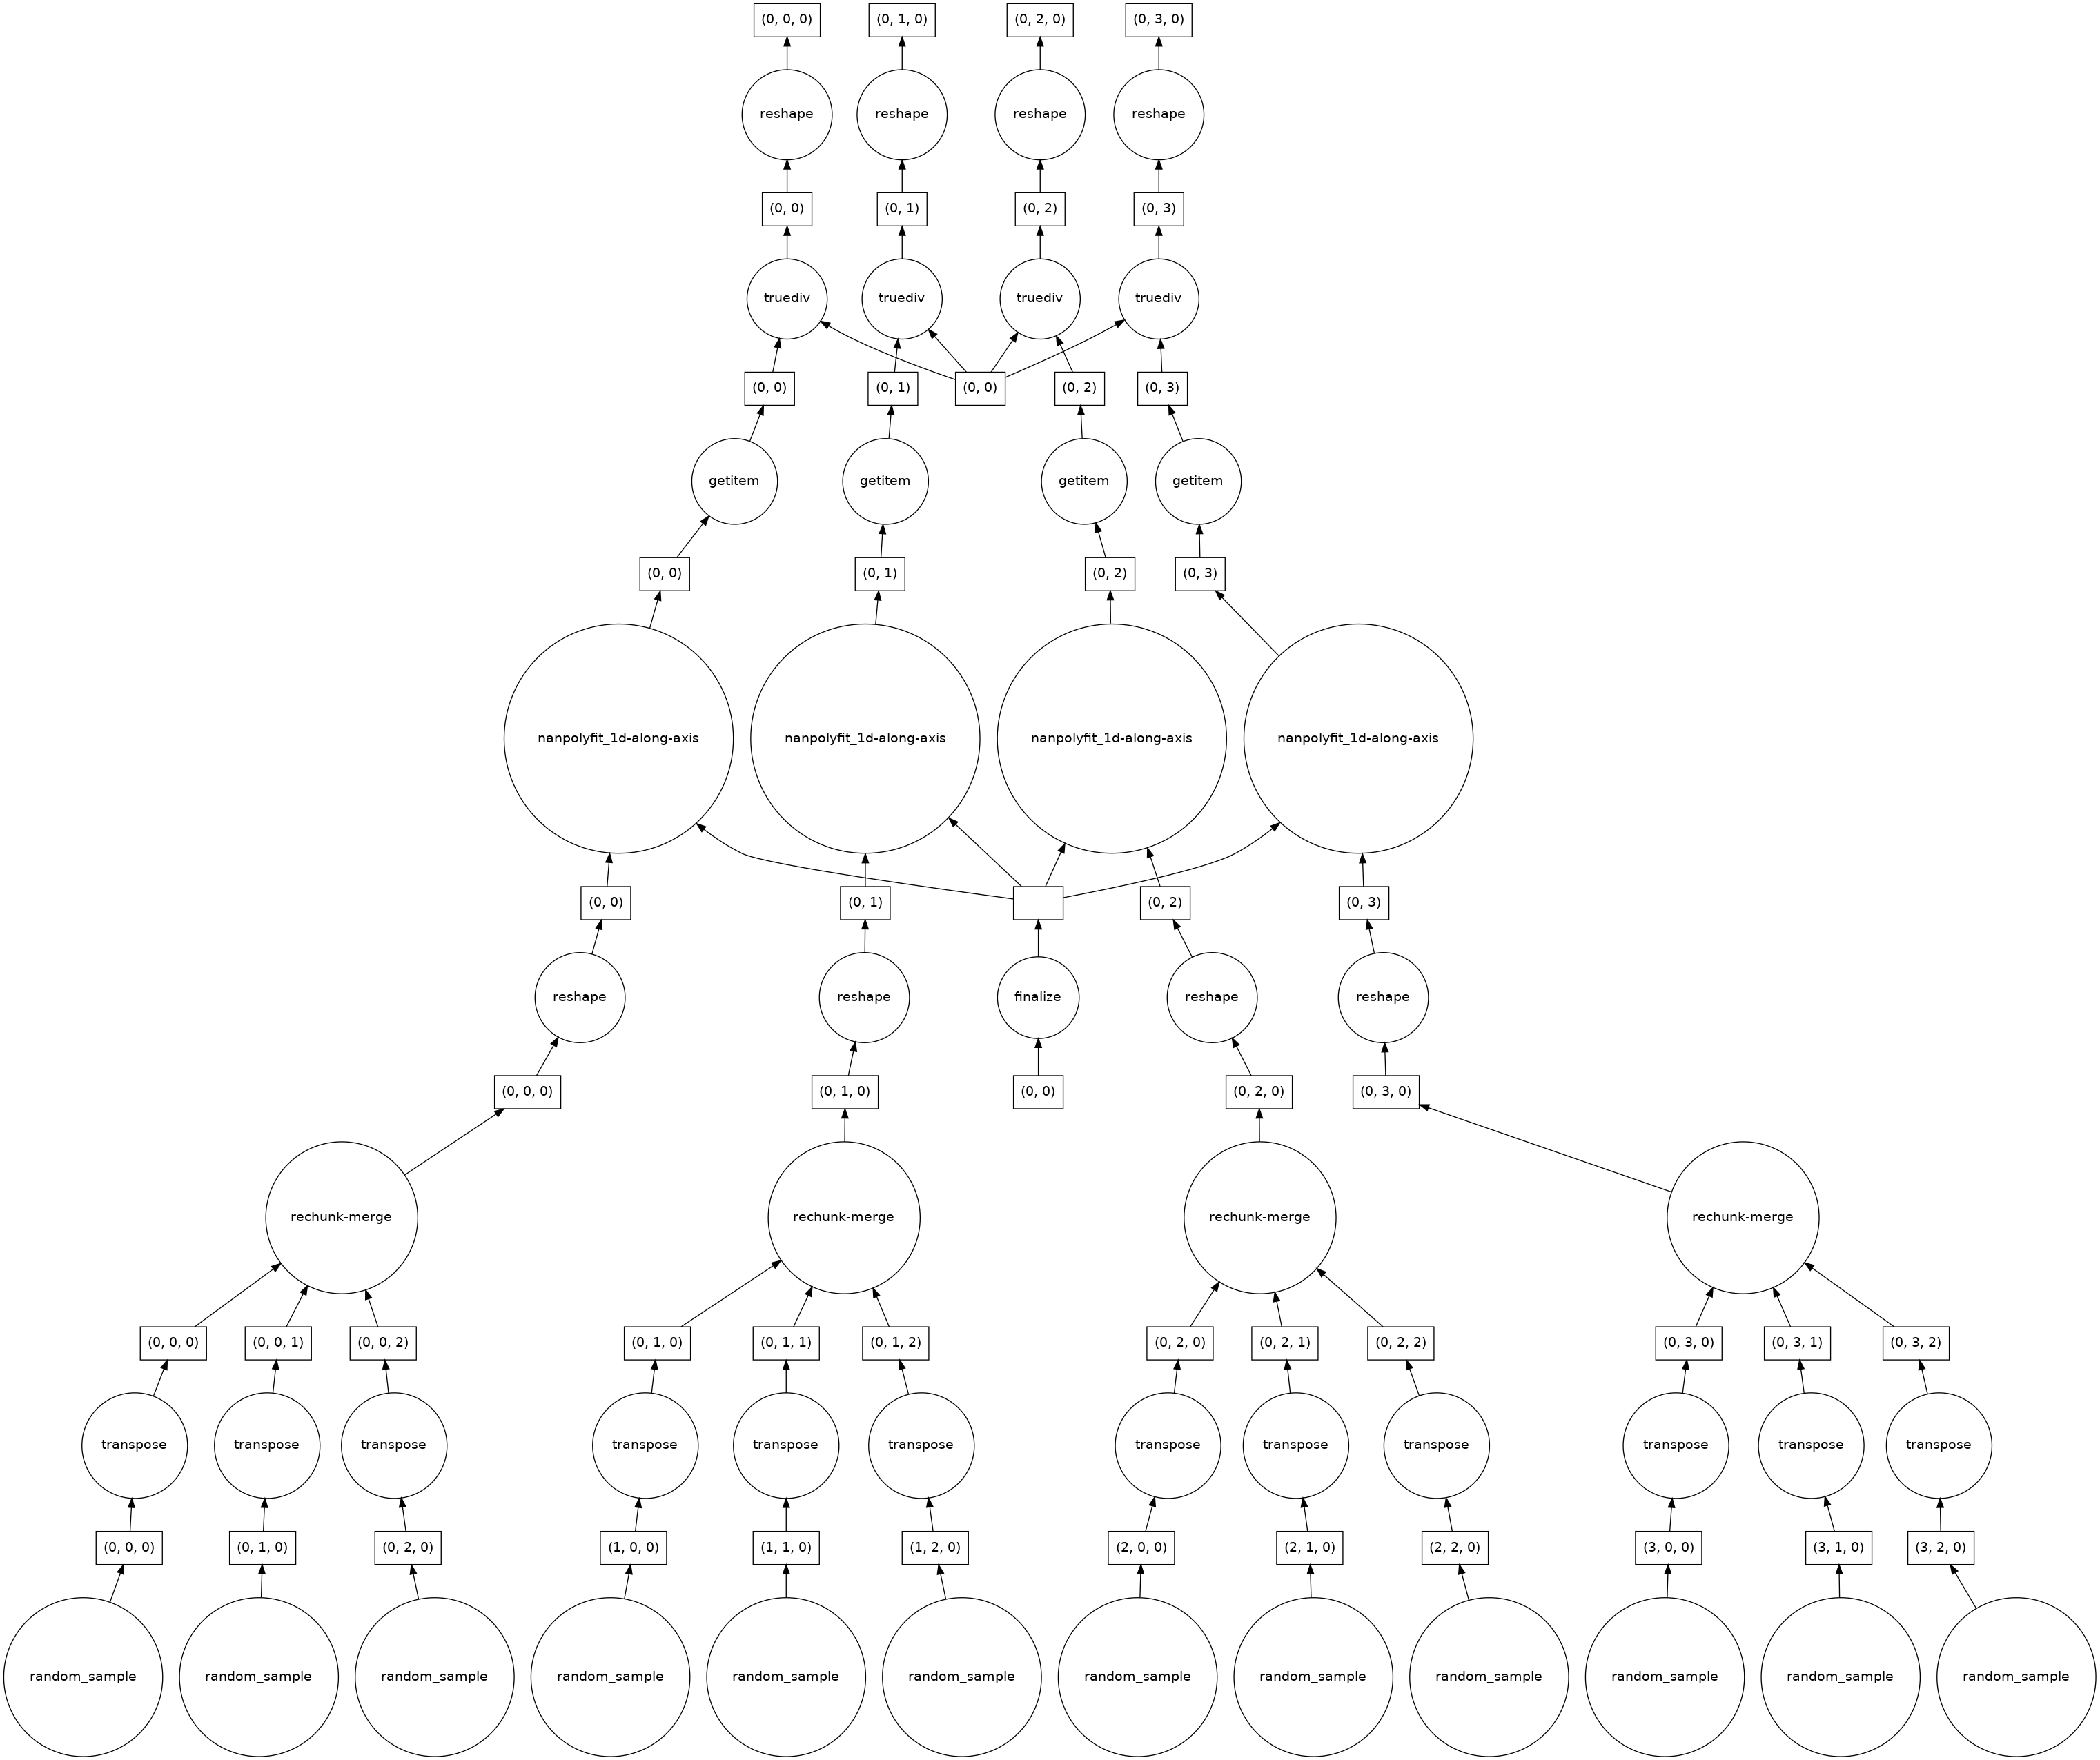
| 950882492 | MDU6SXNzdWU5NTA4ODI0OTI= | 5629 | Polyfit performance on large datasets - Suboptimal dask task graph | jbusecke 14314623 | open | 0 | 15 | 2021-07-22T17:19:52Z | 2023-01-24T20:19:19Z | CONTRIBUTOR | What happened: I am trying to calculate a linear trend over a large climate model simulation. I use rechunker to chunk the data along the horizontal dimensions and make sure that the time dimension (along which I want to calculate the fit) is not chunked. In my realistic example, this blows up the memory of my workers. What you expected to happen: I expected this to work very smoothly because it should be embarassingly parallel (no information of sourrounding chunks is needed and the time dimension is complete in each chunk). Minimal Complete Verifiable Example: I think this minimal example shows that the task graph created is not ideal
When I apply polyfit I get this
Now the number of chunks has decreased to 4? I am not sure why, but this indicates to me that my problem might be related to #4554. When I look at the task graph it seems that this explains why for very large dataset the computation blows up:
As I said before I would expect this calculation to be fully parallelizable, but there seems to be some aggregation/rechunking steps in the bottom layer. How 'bad' these get (e.g. how many input chunks get lumped together in the cc @TomNicholas Anything else we need to know?: Environment: Output of <tt>xr.show_versions()</tt>INSTALLED VERSIONS ------------------ commit: None python: 3.8.8 | packaged by conda-forge | (default, Feb 20 2021, 16:22:27) [GCC 9.3.0] python-bits: 64 OS: Linux OS-release: 5.4.89+ machine: x86_64 processor: x86_64 byteorder: little LC_ALL: C.UTF-8 LANG: C.UTF-8 LOCALE: en_US.UTF-8 libhdf5: 1.10.6 libnetcdf: 4.7.4 xarray: 0.17.0 pandas: 1.2.4 numpy: 1.20.2 scipy: 1.6.2 netCDF4: 1.5.6 pydap: installed h5netcdf: 0.11.0 h5py: 3.2.1 Nio: None zarr: 2.7.1 cftime: 1.4.1 nc_time_axis: 1.2.0 PseudoNetCDF: None rasterio: 1.2.2 cfgrib: 0.9.9.0 iris: None bottleneck: 1.3.2 dask: 2021.04.1 distributed: 2021.04.1 matplotlib: 3.4.1 cartopy: 0.19.0 seaborn: None numbagg: None pint: 0.17 setuptools: 49.6.0.post20210108 pip: 20.3.4 conda: None pytest: None IPython: 7.22.0 sphinx: None |
{
    "url": "https://api.github.com/repos/pydata/xarray/issues/5629/reactions",
    "total_count": 0,
    "+1": 0,
    "-1": 0,
    "laugh": 0,
    "hooray": 0,
    "confused": 0,
    "heart": 0,
    "rocket": 0,
    "eyes": 0
} |
xarray 13221727 | issue | ||||||||
| 1452118523 | I_kwDOAMm_X85WjZH7 | 7293 | Clarify that `chunks={}` in `.open_dataset` reproduces the default behavior of deprecated `.open_zarr` | jbusecke 14314623 | closed | 0 | 1 | 2022-11-16T18:58:47Z | 2023-01-13T20:50:34Z | 2023-01-13T20:50:34Z | CONTRIBUTOR | What is your issue?I was wondering if we could add some language to the docstring of the current text is:
I found that for opening large zarr stores, setting
to make this clear for users who have been using |
{
    "url": "https://api.github.com/repos/pydata/xarray/issues/7293/reactions",
    "total_count": 0,
    "+1": 0,
    "-1": 0,
    "laugh": 0,
    "hooray": 0,
    "confused": 0,
    "heart": 0,
    "rocket": 0,
    "eyes": 0
} |
completed | xarray 13221727 | issue | ||||||
| 1197655735 | I_kwDOAMm_X85HYsa3 | 6459 | Support **kwargs form in `.chunk()` | jbusecke 14314623 | closed | 0 | 0 | 2022-04-08T18:21:22Z | 2022-04-11T19:36:40Z | 2022-04-11T19:36:40Z | CONTRIBUTOR | Is your feature request related to a problem?Take a simple example
but I cant do this:
Describe the solution you'd likeI would like to be able to use the @TomNicholas Describe alternatives you've consideredNo response Additional contextNo response |
{
    "url": "https://api.github.com/repos/pydata/xarray/issues/6459/reactions",
    "total_count": 4,
    "+1": 4,
    "-1": 0,
    "laugh": 0,
    "hooray": 0,
    "confused": 0,
    "heart": 0,
    "rocket": 0,
    "eyes": 0
} |
completed | xarray 13221727 | issue | ||||||
| 956259734 | MDU6SXNzdWU5NTYyNTk3MzQ= | 5649 | xr.merge bug? when using combine_attrs='drop_conflicts' | jbusecke 14314623 | open | 0 | keewis 14808389 | 3 | 2021-07-29T22:47:43Z | 2022-04-09T03:14:24Z | CONTRIBUTOR | What happened: I have recently encountered a situation where combining two datasets failed, due to the datatype of their attributes. This example illustrates the situation: ```python ds1 = xr.Dataset(attrs={'a':[5]}) ds2 = xr.Dataset(attrs={'a':6}) xr.merge([ds1, ds2], combine_attrs='drop_conflicts')
TypeError Traceback (most recent call last) <ipython-input-12-1c8e82be0882> in <module> 2 ds2 = xr.Dataset(attrs={'a':6}) 3 ----> 4 xr.merge([ds1, ds2], combine_attrs='drop_conflicts') /srv/conda/envs/notebook/lib/python3.8/site-packages/xarray/core/merge.py in merge(objects, compat, join, fill_value, combine_attrs) 898 dict_like_objects.append(obj) 899 --> 900 merge_result = merge_core( 901 dict_like_objects, 902 compat, /srv/conda/envs/notebook/lib/python3.8/site-packages/xarray/core/merge.py in merge_core(objects, compat, join, combine_attrs, priority_arg, explicit_coords, indexes, fill_value) 654 ) 655 --> 656 attrs = merge_attrs( 657 [var.attrs for var in coerced if isinstance(var, (Dataset, DataArray))], 658 combine_attrs, /srv/conda/envs/notebook/lib/python3.8/site-packages/xarray/core/merge.py in merge_attrs(variable_attrs, combine_attrs, context) 544 } 545 ) --> 546 result = { 547 key: value 548 for key, value in result.items() /srv/conda/envs/notebook/lib/python3.8/site-packages/xarray/core/merge.py in <dictcomp>(.0) 547 key: value 548 for key, value in result.items() --> 549 if key not in attrs or equivalent(attrs[key], value) 550 } 551 dropped_keys |= {key for key in attrs if key not in result} /srv/conda/envs/notebook/lib/python3.8/site-packages/xarray/core/utils.py in equivalent(first, second) 171 return duck_array_ops.array_equiv(first, second) 172 elif isinstance(first, list) or isinstance(second, list): --> 173 return list_equiv(first, second) 174 else: 175 return ( /srv/conda/envs/notebook/lib/python3.8/site-packages/xarray/core/utils.py in list_equiv(first, second) 182 def list_equiv(first, second): 183 equiv = True --> 184 if len(first) != len(second): 185 return False 186 else: TypeError: object of type 'int' has no len() ``` Took me a while to find out what the root cause of this was with a fully populated dataset, since the error is less than obvious. What you expected to happen:
In my understanding this should just drop the attribute Is there a way to handle this case more elegantly? Output of <tt>xr.show_versions()</tt>INSTALLED VERSIONS ------------------ commit: None python: 3.8.8 | packaged by conda-forge | (default, Feb 20 2021, 16:22:27) [GCC 9.3.0] python-bits: 64 OS: Linux OS-release: 5.4.89+ machine: x86_64 processor: x86_64 byteorder: little LC_ALL: C.UTF-8 LANG: C.UTF-8 LOCALE: ('en_US', 'UTF-8') libhdf5: 1.10.6 libnetcdf: 4.7.4 xarray: 0.19.1.dev8+gda99a566 pandas: 1.2.4 numpy: 1.20.2 scipy: 1.6.2 netCDF4: 1.5.6 pydap: installed h5netcdf: 0.11.0 h5py: 3.2.1 Nio: None zarr: 2.7.1 cftime: 1.4.1 nc_time_axis: 1.2.0 PseudoNetCDF: None rasterio: 1.2.2 cfgrib: 0.9.9.0 iris: None bottleneck: 1.3.2 dask: 2021.04.1 distributed: 2021.04.1 matplotlib: 3.4.1 cartopy: 0.19.0 seaborn: None numbagg: None pint: 0.17 setuptools: 49.6.0.post20210108 pip: 20.3.4 conda: None pytest: None IPython: 7.22.0 sphinx: None |
{
    "url": "https://api.github.com/repos/pydata/xarray/issues/5649/reactions",
    "total_count": 1,
    "+1": 1,
    "-1": 0,
    "laugh": 0,
    "hooray": 0,
    "confused": 0,
    "heart": 0,
    "rocket": 0,
    "eyes": 0
} |
xarray 13221727 | issue | |||||||
| 1185232773 | I_kwDOAMm_X85GpTeF | 6425 | Expose `coord_mode` in `.pad()` | jbusecke 14314623 | open | 0 | 1 | 2022-03-29T18:06:35Z | 2022-03-30T09:19:05Z | CONTRIBUTOR | Is your feature request related to a problem?I am experiencing some issues with the way coordinates are padded. Currently the coordinates are padded according to the A simple example: ```python import xarray as xr import numpy as np da = xr.DataArray([1,2,3], dims=['x'], coords={'x':[4,5,6]})
da
```
If I pad with But if I pad with Describe the solution you'd likeI would like to be able to do something like this:
Since #3596 internally already defines Possibly related (but I think not incompatible with the changes propsed here?): #3868 Happy to work with @TomNicholas on a PR, but wanted to get some feedback/comments first. cc @dcherian @mark-boer who worked on this code. Describe alternatives you've consideredNo response Additional contextNo response |
{
    "url": "https://api.github.com/repos/pydata/xarray/issues/6425/reactions",
    "total_count": 0,
    "+1": 0,
    "-1": 0,
    "laugh": 0,
    "hooray": 0,
    "confused": 0,
    "heart": 0,
    "rocket": 0,
    "eyes": 0
} |
xarray 13221727 | issue | ||||||||
| 830638672 | MDU6SXNzdWU4MzA2Mzg2NzI= | 5030 | `missing_dims` option for aggregation methods like `mean` and `std` | jbusecke 14314623 | open | 0 | 5 | 2021-03-12T23:12:08Z | 2022-03-03T22:37:16Z | CONTRIBUTOR | I work a lot with climate model output and often loop over several models, of which some have a 'member' dimension and others don't. I end up writing many lines like this:
I recently noticed that I'd love to be able to do:
|
{
    "url": "https://api.github.com/repos/pydata/xarray/issues/5030/reactions",
    "total_count": 0,
    "+1": 0,
    "-1": 0,
    "laugh": 0,
    "hooray": 0,
    "confused": 0,
    "heart": 0,
    "rocket": 0,
    "eyes": 0
} |
xarray 13221727 | issue | ||||||||
| 904000857 | MDExOlB1bGxSZXF1ZXN0NjU1MTkzNzg0 | 5388 | Inconsistent docstring for isel etc. | jbusecke 14314623 | closed | 0 | 1 | 2021-05-27T17:10:17Z | 2021-05-27T19:37:40Z | 2021-05-27T19:37:06Z | CONTRIBUTOR | 0 | pydata/xarray/pulls/5388 | I found that the options for the Not sure I found all occurrences of it here.
|
{
    "url": "https://api.github.com/repos/pydata/xarray/issues/5388/reactions",
    "total_count": 0,
    "+1": 0,
    "-1": 0,
    "laugh": 0,
    "hooray": 0,
    "confused": 0,
    "heart": 0,
    "rocket": 0,
    "eyes": 0
} |
xarray 13221727 | pull | |||||
| 753517739 | MDU6SXNzdWU3NTM1MTc3Mzk= | 4625 | Non lazy behavior for weighted average when using resampled data | jbusecke 14314623 | closed | 0 | 13 | 2020-11-30T14:19:48Z | 2020-12-16T19:05:30Z | 2020-12-16T19:05:30Z | CONTRIBUTOR | I am trying to apply an averaging function to multi year chunks of monthly model data. At the core the function performs a weighted average (and then some coordinate manipulations). I am using ```python from dask.diagnostics import ProgressBar import xarray as xr import numpy as np simple customized weighted mean functiondef mean_func(ds): return ds.weighted(ds.weights).mean('time') example datasett = xr.cftime_range(start='2000', periods=1000, freq='1AS')
weights = xr.DataArray(np.random.rand(len(t)),dims=['time'], coords={'time':t})
data = xr.DataArray(np.random.rand(len(t)),dims=['time'], coords={'time':t, 'weights':weights})
ds = xr.Dataset({'data':data}).chunk({'time':1})
ds
```
Using resample with a simple mean works without any computation being triggered:
But when I do the same step with my custom function, there are some computations showing up
I also confirmed that this not happening when I do not use resample first
Environment: Output of <tt>xr.show_versions()</tt>INSTALLED VERSIONS ------------------ commit: None python: 3.8.6 | packaged by conda-forge | (default, Oct 7 2020, 19:08:05) [GCC 7.5.0] python-bits: 64 OS: Linux OS-release: 3.10.0-1160.2.2.el7.x86_64 machine: x86_64 processor: x86_64 byteorder: little LC_ALL: None LANG: en_US.UTF-8 LOCALE: en_US.UTF-8 libhdf5: 1.10.6 libnetcdf: 4.7.4 xarray: 0.16.2.dev77+g1a4f7bd pandas: 1.1.3 numpy: 1.19.2 scipy: 1.5.2 netCDF4: 1.5.4 pydap: None h5netcdf: 0.8.1 h5py: 2.10.0 Nio: None zarr: 2.4.0 cftime: 1.2.1 nc_time_axis: 1.2.0 PseudoNetCDF: None rasterio: 1.1.3 cfgrib: None iris: None bottleneck: None dask: 2.30.0 distributed: 2.30.0 matplotlib: 3.3.2 cartopy: 0.18.0 seaborn: None numbagg: None pint: 0.16.1 setuptools: 49.6.0.post20201009 pip: 20.2.4 conda: None pytest: 6.1.2 IPython: 7.18.1 sphinx: None |
{
    "url": "https://api.github.com/repos/pydata/xarray/issues/4625/reactions",
    "total_count": 0,
    "+1": 0,
    "-1": 0,
    "laugh": 0,
    "hooray": 0,
    "confused": 0,
    "heart": 0,
    "rocket": 0,
    "eyes": 0
} |
completed | xarray 13221727 | issue | ||||||
| 760375642 | MDExOlB1bGxSZXF1ZXN0NTM1MjE3ODQ5 | 4668 | Fixing non-lazy behavior of sampled+weighted | jbusecke 14314623 | closed | 0 | 6 | 2020-12-09T14:26:08Z | 2020-12-16T19:05:30Z | 2020-12-16T19:05:30Z | CONTRIBUTOR | 0 | pydata/xarray/pulls/4668 |
|
{
    "url": "https://api.github.com/repos/pydata/xarray/issues/4668/reactions",
    "total_count": 0,
    "+1": 0,
    "-1": 0,
    "laugh": 0,
    "hooray": 0,
    "confused": 0,
    "heart": 0,
    "rocket": 0,
    "eyes": 0
} |
xarray 13221727 | pull | |||||
| 754558237 | MDU6SXNzdWU3NTQ1NTgyMzc= | 4635 | Unexpected error when using `weighted` | jbusecke 14314623 | closed | 0 | 2 | 2020-12-01T16:49:39Z | 2020-12-01T20:13:24Z | 2020-12-01T20:13:24Z | CONTRIBUTOR | What happened: I just updated to the newest upstream master of xarray to branch of a pull request for #4625 and noticed a strange error in my regular workflow. I am working with a dataset
and when I try to apply a weighted mean with
I get the following error, which I do not understand: ```TypeError Traceback (most recent call last) <ipython-input-101-b08fde69b74b> in <module> ----> 1 test = transformed_ds.o2.weighted(transformed_ds.dz_t).mean('time') ~/code/xarray/xarray/core/common.py in weighted(self, weights) 788 """ 789 --> 790 return self._weighted_cls(self, weights) 791 792 def rolling( ~/code/xarray/xarray/core/weighted.py in init(self, obj, weights) 121 _weight_check(weights.data) 122 --> 123 self.obj = obj 124 self.weights = weights 125 TypeError: descriptor 'obj' for 'Weighted' objects doesn't apply to a 'DataArrayWeighted' object ``` Using the synthetic example from #4625 this does not show up. I am wondering if anybody has an idea what could be wrong with my dataset that would cause this error? Anything else we need to know?: Environment: Output of <tt>xr.show_versions()</tt>INSTALLED VERSIONS ------------------ commit: None python: 3.8.6 | packaged by conda-forge | (default, Oct 7 2020, 19:08:05) [GCC 7.5.0] python-bits: 64 OS: Linux OS-release: 3.10.0-1160.2.2.el7.x86_64 machine: x86_64 processor: x86_64 byteorder: little LC_ALL: None LANG: en_US.UTF-8 LOCALE: en_US.UTF-8 libhdf5: 1.10.6 libnetcdf: 4.7.4 xarray: 0.16.3.dev2+ga41edc7.d20201201 pandas: 1.1.3 numpy: 1.19.2 scipy: 1.5.2 netCDF4: 1.5.4 pydap: None h5netcdf: 0.8.1 h5py: 2.10.0 Nio: None zarr: 2.4.0 cftime: 1.2.1 nc_time_axis: 1.2.0 PseudoNetCDF: None rasterio: 1.1.3 cfgrib: None iris: None bottleneck: None dask: 2.30.0 distributed: 2.30.0 matplotlib: 3.3.2 cartopy: 0.18.0 seaborn: None numbagg: None pint: 0.16.1 setuptools: 49.6.0.post20201009 pip: 20.2.4 conda: None pytest: 6.1.2 IPython: 7.18.1 sphinx: None |
{
    "url": "https://api.github.com/repos/pydata/xarray/issues/4635/reactions",
    "total_count": 0,
    "+1": 0,
    "-1": 0,
    "laugh": 0,
    "hooray": 0,
    "confused": 0,
    "heart": 0,
    "rocket": 0,
    "eyes": 0
} |
completed | xarray 13221727 | issue | ||||||
| 733789095 | MDExOlB1bGxSZXF1ZXN0NTEzNDg0MzM0 | 4559 | Dask friendly check in `.weighted()` | jbusecke 14314623 | closed | 0 | 15 | 2020-10-31T19:11:37Z | 2020-11-09T16:22:51Z | 2020-11-09T16:22:45Z | CONTRIBUTOR | 0 | pydata/xarray/pulls/4559 |
|
{
    "url": "https://api.github.com/repos/pydata/xarray/issues/4559/reactions",
    "total_count": 0,
    "+1": 0,
    "-1": 0,
    "laugh": 0,
    "hooray": 0,
    "confused": 0,
    "heart": 0,
    "rocket": 0,
    "eyes": 0
} |
xarray 13221727 | pull | |||||
| 729980097 | MDU6SXNzdWU3Mjk5ODAwOTc= | 4541 | Option to skip tests in `weighted()` | jbusecke 14314623 | closed | 0 | 16 | 2020-10-26T23:32:36Z | 2020-11-09T16:22:45Z | 2020-11-09T16:22:45Z | CONTRIBUTOR | When working with large dask-array weights, this check triggers computation of the array. This affects xgcms ability to layer operations lazily Would you be open to implement an option to skip this test, maybe with a warning displayed? Happy to submit a PR. |
{
    "url": "https://api.github.com/repos/pydata/xarray/issues/4541/reactions",
    "total_count": 0,
    "+1": 0,
    "-1": 0,
    "laugh": 0,
    "hooray": 0,
    "confused": 0,
    "heart": 0,
    "rocket": 0,
    "eyes": 0
} |
completed | xarray 13221727 | issue | ||||||
| 627600168 | MDU6SXNzdWU2Mjc2MDAxNjg= | 4112 | Unexpected chunking behavior when using `xr.align` with `join='outer'` | jbusecke 14314623 | open | 0 | 6 | 2020-05-29T23:46:31Z | 2020-10-06T20:20:34Z | CONTRIBUTOR | I just came across some unexpected behavior, when using MCVE Code Sample```python import numpy as np import xarray as xr short_time = xr.cftime_range('2000', periods=12) long_time = xr.cftime_range('2000', periods=120) data_short = np.random.rand(len(short_time)) data_long = np.random.rand(len(long_time)) a = xr.DataArray(data_short, dims=['time'], coords={'time':short_time}).chunk({'time':3}) b = xr.DataArray(data_long, dims=['time'], coords={'time':long_time}).chunk({'time':3}) a,b = xr.align(a,b, join = 'outer') ``` Expected OutputAs expected But the filled values do not replicate the chunking along the time dimension in
(Quick shoutout for the amazing html representation. This made diagnosing this problem super easy! 🥳 ) Problem DescriptionI think for many problems it would be more appropriate if the padded portion of the array would have a chunking scheme like the longer array. A practical example (which brought me to this issue) is given in the CMIP6 data archive, where some models give output for several members, with some of them running longer than others, leading to problems when these are combined (see intake-esm/#225).
Basically for that particular model, there are 5 members with a runtime of 100 years and one member with a runtime of 300 years. I think using Is there a way to work around this, or is this behavior intended and I am missing something? cc'ing @dcherian @andersy005 VersionsOutput of <tt>xr.show_versions()</tt>INSTALLED VERSIONS ------------------ commit: None python: 3.8.2 | packaged by conda-forge | (default, Apr 24 2020, 08:20:52) [GCC 7.3.0] python-bits: 64 OS: Linux OS-release: 3.10.0-1127.el7.x86_64 machine: x86_64 processor: x86_64 byteorder: little LC_ALL: None LANG: en_US.UTF-8 LOCALE: en_US.UTF-8 libhdf5: 1.10.5 libnetcdf: 4.7.4 xarray: 0.15.1 pandas: 1.0.3 numpy: 1.18.4 scipy: 1.4.1 netCDF4: 1.5.3 pydap: None h5netcdf: 0.8.0 h5py: 2.10.0 Nio: None zarr: 2.4.0 cftime: 1.1.2 nc_time_axis: 1.2.0 PseudoNetCDF: None rasterio: 1.1.3 cfgrib: None iris: None bottleneck: None dask: 2.15.0 distributed: 2.15.2 matplotlib: 3.2.1 cartopy: 0.18.0 seaborn: None numbagg: None setuptools: 46.1.3.post20200325 pip: 20.1 conda: None pytest: 5.4.2 IPython: 7.14.0 sphinx: None |
{
    "url": "https://api.github.com/repos/pydata/xarray/issues/4112/reactions",
    "total_count": 0,
    "+1": 0,
    "-1": 0,
    "laugh": 0,
    "hooray": 0,
    "confused": 0,
    "heart": 0,
    "rocket": 0,
    "eyes": 0
} |
xarray 13221727 | issue | ||||||||
| 290084668 | MDU6SXNzdWUyOTAwODQ2Njg= | 1845 | speed up opening multiple files with changing data variables | jbusecke 14314623 | closed | 0 | 1 | 2018-01-19T19:38:14Z | 2020-09-23T16:47:37Z | 2020-09-23T16:47:37Z | CONTRIBUTOR | Code Sample, a copy-pastable example if possibleI am trying to open several ocean model data files. During the model run additional variables were written to the files. So for instance the first file will look like this:
<xarray.Dataset>
Dimensions: (st_edges_ocean: 51, st_ocean: 50, time: 1, xt_ocean: 3600, yt_ocean: 2700)
Coordinates:
* xt_ocean (xt_ocean) float64 -279.9 -279.8 -279.7 -279.6 -279.5 ...
* yt_ocean (yt_ocean) float64 -81.11 -81.07 -81.02 -80.98 -80.94 ...
* st_ocean (st_ocean) float64 5.034 15.1 25.22 35.36 45.58 55.85 ...
* st_edges_ocean (st_edges_ocean) float64 0.0 10.07 20.16 30.29 40.47 ...
* time (time) float64 7.25e+04
Data variables:
jp_recycle (time, st_ocean, yt_ocean, xt_ocean) float64 dask.array<shape=(1, 50, 2700, 3600), chunksize=(1, 1, 2700, 3600)>
jp_reminp (time, st_ocean, yt_ocean, xt_ocean) float64 dask.array<shape=(1, 50, 2700, 3600), chunksize=(1, 1, 2700, 3600)>
jp_uptake (time, st_ocean, yt_ocean, xt_ocean) float64 dask.array<shape=(1, 50, 2700, 3600), chunksize=(1, 1, 2700, 3600)>
jo2 (time, st_ocean, yt_ocean, xt_ocean) float64 dask.array<shape=(1, 50, 2700, 3600), chunksize=(1, 1, 2700, 3600)>
dic_stf (time, yt_ocean, xt_ocean) float64 dask.array<shape=(1, 2700, 3600), chunksize=(1, 2700, 3600)>
dic_btf (time, yt_ocean, xt_ocean) float64 dask.array<shape=(1, 2700, 3600), chunksize=(1, 2700, 3600)>
o2_stf (time, yt_ocean, xt_ocean) float64 dask.array<shape=(1, 2700, 3600), chunksize=(1, 2700, 3600)>
o2_btf (time, yt_ocean, xt_ocean) float64 dask.array<shape=(1, 2700, 3600), chunksize=(1, 2700, 3600)>
po4_btf (time, yt_ocean, xt_ocean) float64 dask.array<shape=(1, 2700, 3600), chunksize=(1, 2700, 3600)>
Attributes:
date: created 2014-01-08
program: time_average_netcdf.rb
history: Perform time-means on all variables in 01990101.ocean_minibli...
filename: 01990101.ocean_minibling_term_src.nc
title: CM2.6_miniBling
grid_type: mosaic
grid_tile: 1
First of all, I was wondering if there would be the possibility to display a warning if this situation occurs, suggesting to add these variables as Even better would be some way to read such datasets in a fast manner. If we could specify a
INSTALLED VERSIONS
------------------
commit: None
python: 3.6.3.final.0
python-bits: 64
OS: Linux
OS-release: 2.6.32-642.15.1.el6.x86_64
machine: x86_64
processor: x86_64
byteorder: little
LC_ALL: None
LANG: en_US
LOCALE: en_US.ISO8859-1
xarray: 0.10.0rc2-2-g1a01208
pandas: 0.20.3
numpy: 1.13.3
scipy: 0.19.1
netCDF4: 1.3.0
h5netcdf: 0.4.2
Nio: None
bottleneck: 1.2.1
cyordereddict: None
dask: 0.16.0
matplotlib: 2.1.0
cartopy: 0.15.1
seaborn: 0.8.1
setuptools: 36.3.0
pip: 9.0.1
conda: None
pytest: 3.2.3
IPython: 6.2.1
sphinx: None
|
{
    "url": "https://api.github.com/repos/pydata/xarray/issues/1845/reactions",
    "total_count": 0,
    "+1": 0,
    "-1": 0,
    "laugh": 0,
    "hooray": 0,
    "confused": 0,
    "heart": 0,
    "rocket": 0,
    "eyes": 0
} |
completed | xarray 13221727 | issue | ||||||
| 577030502 | MDU6SXNzdWU1NzcwMzA1MDI= | 3841 | Problems plotting long model control runs with gregorian calendar | jbusecke 14314623 | closed | 0 | 6 | 2020-03-06T16:11:50Z | 2020-07-29T17:55:22Z | 2020-07-29T17:55:22Z | CONTRIBUTOR | I noticed a problem the other day, when I tried to plot some very long control run data from CMIP6 on ocean.pangeo.io. The control run of this model (CSIRO's ACCESS-ESM1-5), starts in year 101, but runs for 900 years. If I try to plot the full run as a timeseries at any point in the grid: ``` import xarray as xr import matplotlib.pyplot as plt import intake %matplotlib inline col = intake.open_esm_datastore("https://raw.githubusercontent.com/NCAR/intake-esm-datastore/master/catalogs/pangeo-cmip6.json") cat = col.search(variable_id='o2', source_id='ACCESS-ESM1-5', experiment_id='piControl', table_id='Omon') data_dict = cat.to_dataset_dict(zarr_kwargs={'consolidated': True}) This needs a good amount of dask workers!ds = data_dict['CMIP.CSIRO.ACCESS-ESM1-5.piControl.Omon.gn'] ds.o2.isel(i=180, j=100, lev=0).plot() ``` I get the following error: Error message``` --------------------------------------------------------------------------- ValueError Traceback (most recent call last) /srv/conda/envs/notebook/lib/python3.7/site-packages/ipykernel/pylab/backend_inline.py in show(close, block) 41 display( 42 figure_manager.canvas.figure, ---> 43 metadata=_fetch_figure_metadata(figure_manager.canvas.figure) 44 ) 45 finally: /srv/conda/envs/notebook/lib/python3.7/site-packages/ipykernel/pylab/backend_inline.py in _fetch_figure_metadata(fig) 179 # the background is transparent 180 ticksLight = _is_light([label.get_color() --> 181 for axes in fig.axes 182 for axis in (axes.xaxis, axes.yaxis) 183 for label in axis.get_ticklabels()]) /srv/conda/envs/notebook/lib/python3.7/site-packages/ipykernel/pylab/backend_inline.py in <listcomp>(.0) 181 for axes in fig.axes 182 for axis in (axes.xaxis, axes.yaxis) --> 183 for label in axis.get_ticklabels()]) 184 if ticksLight.size and (ticksLight == ticksLight[0]).all(): 185 # there are one or more tick labels, all with the same lightness /srv/conda/envs/notebook/lib/python3.7/site-packages/matplotlib/axis.py in get_ticklabels(self, minor, which) 1294 if minor: 1295 return self.get_minorticklabels() -> 1296 return self.get_majorticklabels() 1297 1298 def get_majorticklines(self): /srv/conda/envs/notebook/lib/python3.7/site-packages/matplotlib/axis.py in get_majorticklabels(self) 1250 def get_majorticklabels(self): 1251 'Return a list of Text instances for the major ticklabels.' -> 1252 ticks = self.get_major_ticks() 1253 labels1 = [tick.label1 for tick in ticks if tick.label1.get_visible()] 1254 labels2 = [tick.label2 for tick in ticks if tick.label2.get_visible()] /srv/conda/envs/notebook/lib/python3.7/site-packages/matplotlib/axis.py in get_major_ticks(self, numticks) 1405 'Get the tick instances; grow as necessary.' 1406 if numticks is None: -> 1407 numticks = len(self.get_majorticklocs()) 1408 1409 while len(self.majorTicks) < numticks: /srv/conda/envs/notebook/lib/python3.7/site-packages/matplotlib/axis.py in get_majorticklocs(self) 1322 def get_majorticklocs(self): 1323 """Get the array of major tick locations in data coordinates.""" -> 1324 return self.major.locator() 1325 1326 def get_minorticklocs(self): /srv/conda/envs/notebook/lib/python3.7/site-packages/nc_time_axis/__init__.py in __call__(self) 136 def __call__(self): 137 vmin, vmax = self.axis.get_view_interval() --> 138 return self.tick_values(vmin, vmax) 139 140 def tick_values(self, vmin, vmax): /srv/conda/envs/notebook/lib/python3.7/site-packages/nc_time_axis/__init__.py in tick_values(self, vmin, vmax) 192 raise ValueError(msg) 193 --> 194 return utime.date2num(ticks) 195 196 cftime/_cftime.pyx in cftime._cftime.utime.date2num() cftime/_cftime.pyx in cftime._cftime.JulianDayFromDate() cftime/_cftime.pyx in cftime._cftime._IntJulianDayFromDate() ValueError: year zero does not exist in the proleptic_gregorian calendar ```When I restrict the timeseries to a shorter time it works fine:
I assume that the internal logic tries to set the xlimit on the left side to some negative year if the full range is large. Is there a way to suppress that behavior? Or could the plotting routine default to a leftmost date of year 1 for any cftime data with gregorian calendar? |
{
    "url": "https://api.github.com/repos/pydata/xarray/issues/3841/reactions",
    "total_count": 0,
    "+1": 0,
    "-1": 0,
    "laugh": 0,
    "hooray": 0,
    "confused": 0,
    "heart": 0,
    "rocket": 0,
    "eyes": 0
} |
completed | xarray 13221727 | issue | ||||||
| 279909699 | MDU6SXNzdWUyNzk5MDk2OTk= | 1765 | Error when using .apply_ufunc with .groupby_bins | jbusecke 14314623 | closed | 0 | 7 | 2017-12-06T21:17:34Z | 2020-03-25T15:31:02Z | 2020-03-25T15:31:01Z | CONTRIBUTOR | I am trying to create a function that applies a .groupby_bins operation over specified dimensions of a xarray dataset. E.g. I want to be able to sum temperture, salinity and other values grouped by oceanic oxygen concentrations. I want to be able to be flexible over which dimensions I apply the groupby_bins operation. For instance, I would like to apply it in every depth colum (resulting in an array of (x,y,time) but also over all spatial dimensions, resulting in a timeseries. I currently run into a strange error when I try the following. Code Sample, a copy-pastable example if possible
```python def _func(data, bin_data, bins): """Group unlabeled array 'data' according to values in 'bin_data' using bins defined in 'bins' and sum all values""" labels = bins[1:] da_data = xr.DataArray(data, name='data') da_bin_data = xr.DataArray(bin_data, name='bin_data') def wrapper(obj, bin_obj, bins, dims): obj = obj.copy() bin_obj = bin_obj.copy() n_bins = len(bins)-1
Groupby bins problem with small bins?x_raw = np.arange(20) y_raw = np.arange(10) z_raw = np.arange(15) x = xr.DataArray(dsa.from_array(x_raw, chunks=(-1)), dims=['x'], coords={'x':('x', x_raw)}) y = xr.DataArray(dsa.from_array(y_raw, chunks=(-1)), dims=['y'], coords={'y':('y', y_raw)}) z = xr.DataArray(dsa.from_array(z_raw, chunks=(-1)), dims=['z'], coords={'z':('z', z_raw)}) da = xr.DataArray(dsa.ones([20, 10, 15], chunks=[-1, -1, -1]), dims=['x', 'y', 'z'], coords={ 'x':x, 'y':y, 'z':z }) da ```
```python bins = np.arange(0,30,1) apply private function on unlabled arraybinned_data = _func(da.data, da.data, bins)
print(binned_data.compute())
```ValueError Traceback (most recent call last) <ipython-input-13-05a5150badbf> in <module>() 1 binned_full = wrapper(da, da, bins, dims=['x','y','z']) ----> 2 print(binned_full.data.compute()) ~/miniconda/envs/standard/lib/python3.6/site-packages/dask/base.py in compute(self, kwargs) 133 dask.base.compute 134 """ --> 135 (result,) = compute(self, traverse=False, kwargs) 136 return result 137 ~/miniconda/envs/standard/lib/python3.6/site-packages/dask/base.py in compute(args, kwargs) 331 postcomputes = [a.dask_postcompute() if is_dask_collection(a) 332 else (None, a) for a in args] --> 333 results = get(dsk, keys, kwargs) 334 results_iter = iter(results) 335 return tuple(a if f is None else f(next(results_iter), a) ~/miniconda/envs/standard/lib/python3.6/site-packages/dask/threaded.py in get(dsk, result, cache, num_workers, kwargs) 73 results = get_async(pool.apply_async, len(pool._pool), dsk, result, 74 cache=cache, get_id=_thread_get_id, ---> 75 pack_exception=pack_exception, kwargs) 76 77 # Cleanup pools associated to dead threads ~/miniconda/envs/standard/lib/python3.6/site-packages/dask/local.py in get_async(apply_async, num_workers, dsk, result, cache, get_id, rerun_exceptions_locally, pack_exception, raise_exception, callbacks, dumps, loads, **kwargs) 519 _execute_task(task, data) # Re-execute locally 520 else: --> 521 raise_exception(exc, tb) 522 res, worker_id = loads(res_info) 523 state['cache'][key] = res ~/miniconda/envs/standard/lib/python3.6/site-packages/dask/compatibility.py in reraise(exc, tb) 58 if exc.traceback is not tb: 59 raise exc.with_traceback(tb) ---> 60 raise exc 61 62 else: ~/miniconda/envs/standard/lib/python3.6/site-packages/dask/local.py in execute_task(key, task_info, dumps, loads, get_id, pack_exception) 288 try: 289 task, data = loads(task_info) --> 290 result = _execute_task(task, data) 291 id = get_id() 292 result = dumps((result, id)) ~/miniconda/envs/standard/lib/python3.6/site-packages/dask/local.py in _execute_task(arg, cache, dsk) 269 func, args = arg[0], arg[1:] 270 args2 = [_execute_task(a, cache) for a in args] --> 271 return func(*args2) 272 elif not ishashable(arg): 273 return arg ~/miniconda/envs/standard/lib/python3.6/site-packages/numpy/lib/function_base.py in call(self, args, *kwargs) 2737 vargs.extend([kwargs[_n] for _n in names]) 2738 -> 2739 return self._vectorize_call(func=func, args=vargs) 2740 2741 def _get_ufunc_and_otypes(self, func, args): ~/miniconda/envs/standard/lib/python3.6/site-packages/numpy/lib/function_base.py in _vectorize_call(self, func, args)
2803 """Vectorized call to ~/miniconda/envs/standard/lib/python3.6/site-packages/numpy/lib/function_base.py in _vectorize_call_with_signature(self, func, args) 2844 2845 for index in np.ndindex(broadcast_shape): -> 2846 results = func((arg[index] for arg in args)) 2847 2848 n_results = len(results) if isinstance(results, tuple) else 1 <ipython-input-5-6d60d3b0b704> in _func(data, bin_data, bins) 7 8 binned = da_data.groupby_bins(da_bin_data, bins, labels=labels, ----> 9 include_lowest=True).sum() 10 return binned 11 ~/Work/CODE/PYTHON/xarray/xarray/core/common.py in groupby_bins(self, group, bins, right, labels, precision, include_lowest, squeeze) 466 cut_kwargs={'right': right, 'labels': labels, 467 'precision': precision, --> 468 'include_lowest': include_lowest}) 469 470 def rolling(self, min_periods=None, center=False, **windows): ~/Work/CODE/PYTHON/xarray/xarray/core/groupby.py in init(self, obj, group, squeeze, grouper, bins, cut_kwargs) 225 226 if bins is not None: --> 227 binned = pd.cut(group.values, bins, **cut_kwargs) 228 new_dim_name = group.name + '_bins' 229 group = DataArray(binned, group.coords, name=new_dim_name) ~/miniconda/envs/standard/lib/python3.6/site-packages/pandas/core/reshape/tile.py in cut(x, bins, right, labels, retbins, precision, include_lowest) 134 precision=precision, 135 include_lowest=include_lowest, --> 136 dtype=dtype) 137 138 return _postprocess_for_cut(fac, bins, retbins, x_is_series, ~/miniconda/envs/standard/lib/python3.6/site-packages/pandas/core/reshape/tile.py in _bins_to_cuts(x, bins, right, labels, precision, include_lowest, dtype, duplicates) 227 return result, bins 228 --> 229 unique_bins = algos.unique(bins) 230 if len(unique_bins) < len(bins) and len(bins) != 2: 231 if duplicates == 'raise': ~/miniconda/envs/standard/lib/python3.6/site-packages/pandas/core/algorithms.py in unique(values) 362 363 table = htable(len(values)) --> 364 uniques = table.unique(values) 365 uniques = _reconstruct_data(uniques, dtype, original) 366 pandas/_libs/hashtable_class_helper.pxi in pandas._libs.hashtable.Int64HashTable.unique() ~/miniconda/envs/standard/lib/python3.6/site-packages/pandas/_libs/hashtable.cpython-36m-darwin.so in View.MemoryView.memoryview_cwrapper() ~/miniconda/envs/standard/lib/python3.6/site-packages/pandas/_libs/hashtable.cpython-36m-darwin.so in View.MemoryView.memoryview.cinit() ValueError: buffer source array is read-only ``` This error only gets triggered upon computation. Problem descriptionI am not sure If this is a bug or a user error on my side. I am still trying to get used to I am not sure if the rewrapping in xr.DataArrays in Output of
|
{
    "url": "https://api.github.com/repos/pydata/xarray/issues/1765/reactions",
    "total_count": 0,
    "+1": 0,
    "-1": 0,
    "laugh": 0,
    "hooray": 0,
    "confused": 0,
    "heart": 0,
    "rocket": 0,
    "eyes": 0
} |
completed | xarray 13221727 | issue | ||||||
| 429511994 | MDU6SXNzdWU0Mjk1MTE5OTQ= | 2867 | Very slow coordinate assignment with dask array | jbusecke 14314623 | closed | 0 | 7 | 2019-04-04T22:36:57Z | 2019-12-19T17:28:10Z | 2019-12-17T16:21:23Z | CONTRIBUTOR | I am trying to reconstruct vertical cell depth from a z-star ocean model. This involves a few operations involving both dimensions and coordinates of a dataset like this:
The problematic step is when I assign the calculated dask.arrays to the original dataset.
This happens in a function like this.
This takes very long compared to a version where I assign the values as data variables:
I have profiled my more complex code involving this function and it seems like there is a substantial increase in calls to Profile output of the first version (assigning coordinates)
27662983 function calls (26798524 primitive calls) in 71.940 seconds
Ordered by: internal time
ncalls tottime percall cumtime percall filename:lineno(function)
268632 46.914 0.000 46.914 0.000 {method 'acquire' of '_thread.lock' objects}
438 4.296 0.010 4.296 0.010 {method 'read' of '_io.BufferedReader' objects}
76883 1.909 0.000 1.939 0.000 local.py:240(release_data)
144 1.489 0.010 4.519 0.031 rechunk.py:514(_compute_rechunk)
...
For the second version (assigning data variables)
12928834 function calls (12489174 primitive calls) in 16.554 seconds
Ordered by: internal time
ncalls tottime percall cumtime percall filename:lineno(function)
438 3.841 0.009 3.841 0.009 {method 'read' of '_io.BufferedReader' objects}
9492 3.675 0.000 3.675 0.000 {method 'acquire' of '_thread.lock' objects}
144 1.673 0.012 4.712 0.033 rechunk.py:514(_compute_rechunk)
...
Does anyone have a feel for why this could happen or how I could refine my testing to get to the bottom of this? Output of
|
{
    "url": "https://api.github.com/repos/pydata/xarray/issues/2867/reactions",
    "total_count": 0,
    "+1": 0,
    "-1": 0,
    "laugh": 0,
    "hooray": 0,
    "confused": 0,
    "heart": 0,
    "rocket": 0,
    "eyes": 0
} |
completed | xarray 13221727 | issue | ||||||
| 513916063 | MDU6SXNzdWU1MTM5MTYwNjM= | 3454 | Large coordinate arrays trigger computation | jbusecke 14314623 | closed | 0 | 2 | 2019-10-29T13:27:00Z | 2019-10-29T15:07:43Z | 2019-10-29T15:07:43Z | CONTRIBUTOR | I want to bring up an issue that has tripped up my workflow with large climate models many times. I am dealing with large data arrays of vertical cell thickness. These are 4d arrays (x, y, z, time) but I would define them as coordinates, not data_variables in the xarrays data model (e.g. they should not be multiplied by a value if a dataset is multiplied). These sort of coordinates might become more prevalent with newer ocean models like MOM6 Whenever I assign these arrays as coordinates operations on the arrays seem to trigger computation, whereas they don't if I set them up as data_variables. The example below shows this behavior. Is this a bug or done on purpose? Is there a workaround to keep these vertical thicknesses as coordinates? ``` import xarray as xr import numpy as np import dask.array as dsa create dataset with with vertical thickness
|
{
    "url": "https://api.github.com/repos/pydata/xarray/issues/3454/reactions",
    "total_count": 0,
    "+1": 0,
    "-1": 0,
    "laugh": 0,
    "hooray": 0,
    "confused": 0,
    "heart": 0,
    "rocket": 0,
    "eyes": 0
} |
completed | xarray 13221727 | issue | ||||||
| 279883145 | MDU6SXNzdWUyNzk4ODMxNDU= | 1764 | .groupby_bins fails when data is not contained in bins | jbusecke 14314623 | closed | 0 | 0.11.1 3801867 | 2 | 2017-12-06T19:48:30Z | 2019-10-22T14:53:31Z | 2019-10-22T14:53:30Z | CONTRIBUTOR | Consider the following example.
Groupby bins problem with small bins?x_raw = np.arange(20) y_raw = np.arange(10) z_raw = np.arange(15) x = xr.DataArray(dsa.from_array(x_raw, chunks=(-1)), dims=['x'], coords={'x':('x', x_raw)}) y = xr.DataArray(dsa.from_array(y_raw, chunks=(-1)), dims=['y'], coords={'y':('y', y_raw)}) z = xr.DataArray(dsa.from_array(z_raw, chunks=(-1)), dims=['z'], coords={'z':('z', z_raw)}) data = xr.DataArray(dsa.ones([20, 10, 15], chunks=[-1, -1, -1]), dims=['x', 'y', 'z'], coords={
'x':x, 'y':y, 'z':z
})
data
This dask array only contains ones. If I now try to apply groupby_bins with a specified array of bins (which are all below 1) it fails with a rather cryptic error. ``` ``` This doesnt workbins = np.array([0, 20, 40, 60 , 80, 100])*1e-6 binned = data.groupby_bins(data, bins).sum()
binned
StopIteration Traceback (most recent call last) <ipython-input-7-dc9283bee4ea> in <module>() 2 bins = np.array([0, 20, 40, 60 , 80, 100])*1e-6 3 ----> 4 binned = data.groupby_bins(data, bins).sum() 5 binned ~/Work/CODE/PYTHON/xarray/xarray/core/common.py in wrapped_func(self, dim, axis, skipna, keep_attrs, kwargs) 20 keep_attrs=False, kwargs): 21 return self.reduce(func, dim, axis, keep_attrs=keep_attrs, ---> 22 skipna=skipna, allow_lazy=True, **kwargs) 23 else: 24 def wrapped_func(self, dim=None, axis=None, keep_attrs=False, ~/Work/CODE/PYTHON/xarray/xarray/core/groupby.py in reduce(self, func, dim, axis, keep_attrs, shortcut, kwargs) 572 def reduce_array(ar): 573 return ar.reduce(func, dim, axis, keep_attrs=keep_attrs, kwargs) --> 574 return self.apply(reduce_array, shortcut=shortcut) 575 576 ops.inject_reduce_methods(DataArrayGroupBy) ~/Work/CODE/PYTHON/xarray/xarray/core/groupby.py in apply(self, func, shortcut, kwargs) 516 applied = (maybe_wrap_array(arr, func(arr, kwargs)) 517 for arr in grouped) --> 518 return self._combine(applied, shortcut=shortcut) 519 520 def _combine(self, applied, shortcut=False): ~/Work/CODE/PYTHON/xarray/xarray/core/groupby.py in _combine(self, applied, shortcut) 520 def _combine(self, applied, shortcut=False): 521 """Recombine the applied objects like the original.""" --> 522 applied_example, applied = peek_at(applied) 523 coord, dim, positions = self._infer_concat_args(applied_example) 524 if shortcut: ~/Work/CODE/PYTHON/xarray/xarray/core/utils.py in peek_at(iterable) 114 """ 115 gen = iter(iterable) --> 116 peek = next(gen) 117 return peek, itertools.chain([peek], gen) 118 StopIteration: ``` If however the last bin includes the value 1 it runs as expected: ``` If I include a larger value at the end it worksbins = np.array([0, 20, 40, 60 , 80, 100, 1e7])*1e-6 binned = data.groupby_bins(data, bins).sum()
binned
Problem descriptionIs this expected behaviour? I would prefer it if it returned nan values for the bins that capture no values. It took me a bit to find out why my script using this was failing, and if this is expected behavior could a more helpful error message be considered? Expected OutputOutput of
|
{
    "url": "https://api.github.com/repos/pydata/xarray/issues/1764/reactions",
    "total_count": 0,
    "+1": 0,
    "-1": 0,
    "laugh": 0,
    "hooray": 0,
    "confused": 0,
    "heart": 0,
    "rocket": 0,
    "eyes": 0
} |
completed | xarray 13221727 | issue | |||||
| 503562032 | MDU6SXNzdWU1MDM1NjIwMzI= | 3377 | Changed behavior for replacing coordinates on dataset. | jbusecke 14314623 | closed | 0 | 5 | 2019-10-07T16:32:33Z | 2019-10-11T15:47:57Z | 2019-10-11T15:47:57Z | CONTRIBUTOR | MCVE Code SampleWe noticed a change in behavior in xarray that broke a test in xgcm. Consider this code example: ```python import xarray as xr import numpy as np x = np.arange(5) data = xr.DataArray(np.random.rand(5), coords={'x':x }, dims=['x']) x_c = np.arange(5) + 0.5 data_c = xr.DataArray(np.random.rand(5), coords={'x_c':x_c }, dims=['x_c']) ds = xr.Dataset({'data':data, 'data_c':data_c}) del ds['data_c'] ds['x_c'] = ds['x_c'][:3] ds ``` Expected OutputIn previous versions of xarray this resulted in
In the current master branch instead the coordinate gets padded with nans:
Problem DescriptionWe fixed the test in a new PR, but @dcherian encouraged me to submit this. Output of
|
{
    "url": "https://api.github.com/repos/pydata/xarray/issues/3377/reactions",
    "total_count": 0,
    "+1": 0,
    "-1": 0,
    "laugh": 0,
    "hooray": 0,
    "confused": 0,
    "heart": 0,
    "rocket": 0,
    "eyes": 0
} |
completed | xarray 13221727 | issue | ||||||
| 447361330 | MDU6SXNzdWU0NDczNjEzMzA= | 2982 | cbar_kwargs are ignored for `plot.contourf` | jbusecke 14314623 | open | 0 | 3 | 2019-05-22T21:57:24Z | 2019-05-30T00:36:17Z | CONTRIBUTOR | Code Sample, a copy-pastable example if possibleI just stumbled on some weird behaviour, possibly a bug. When plotting with the ```python import numpy as np import xarray as xr %matplotlib inline test_data = np.random.rand(10, 10)
da = xr.DataArray(test_data)
h = da.plot.contourf(vmax=0.5, cbar_kwargs={"extend": "neither"})
print(h.colorbar.extend)
```
When doing a similar plot with matplotlib this happens ``` matplotlib exampleimport matplotlib.pyplot as plt
ha = plt.contourf(test_data, vmax=0.3)
cb = plt.colorbar(ha, extend='neither')
```
Is xarray adjusting the colorbar to the This makes it especially hard to produce movies with (e.g. xmovie) because the colorbar If someone could point me to the right location in the code and tests, I would be happy to put together a PR. Output of
|
{
    "url": "https://api.github.com/repos/pydata/xarray/issues/2982/reactions",
    "total_count": 0,
    "+1": 0,
    "-1": 0,
    "laugh": 0,
    "hooray": 0,
    "confused": 0,
    "heart": 0,
    "rocket": 0,
    "eyes": 0
} |
xarray 13221727 | issue | ||||||||
| 431584027 | MDU6SXNzdWU0MzE1ODQwMjc= | 2884 | drop all but specified data_variables/coordinates as a convenience function | jbusecke 14314623 | closed | 0 | 5 | 2019-04-10T15:57:03Z | 2019-04-16T12:44:13Z | 2019-04-16T12:44:13Z | CONTRIBUTOR | I often work with datasets that consist out of a lot of data_variables and coordinates. Often I am only concerned about a subset of variables, and for convenience drop all but a selected list of variables with a little snippet like this: Code Sample, a copy-pastable example if possible
I would love to have this functionality available as a DataArray/Dataset function. It could look something like |
{
    "url": "https://api.github.com/repos/pydata/xarray/issues/2884/reactions",
    "total_count": 0,
    "+1": 0,
    "-1": 0,
    "laugh": 0,
    "hooray": 0,
    "confused": 0,
    "heart": 0,
    "rocket": 0,
    "eyes": 0
} |
completed | xarray 13221727 | issue | ||||||
| 433410125 | MDExOlB1bGxSZXF1ZXN0MjcwNjE3NjQ5 | 2894 | Added docs example for `xarray.Dataset.get()` | jbusecke 14314623 | closed | 0 | 7 | 2019-04-15T18:03:20Z | 2019-04-16T12:44:13Z | 2019-04-16T12:44:13Z | CONTRIBUTOR | 0 | pydata/xarray/pulls/2894 | Added example of |
{
    "url": "https://api.github.com/repos/pydata/xarray/issues/2894/reactions",
    "total_count": 0,
    "+1": 0,
    "-1": 0,
    "laugh": 0,
    "hooray": 0,
    "confused": 0,
    "heart": 0,
    "rocket": 0,
    "eyes": 0
} |
xarray 13221727 | pull | |||||
| 433522846 | MDExOlB1bGxSZXF1ZXN0MjcwNzA3ODYw | 2897 | Bugfix for docs build instructions | jbusecke 14314623 | closed | 0 | 1 | 2019-04-15T23:42:36Z | 2019-04-16T04:22:43Z | 2019-04-16T03:57:28Z | CONTRIBUTOR | 0 | pydata/xarray/pulls/2897 | Added clearer instructions on how to build xarray documentation for contribution guide - [x] Closes #2893 |
{
    "url": "https://api.github.com/repos/pydata/xarray/issues/2897/reactions",
    "total_count": 0,
    "+1": 0,
    "-1": 0,
    "laugh": 0,
    "hooray": 0,
    "confused": 0,
    "heart": 0,
    "rocket": 0,
    "eyes": 0
} |
xarray 13221727 | pull | |||||
| 433406684 | MDU6SXNzdWU0MzM0MDY2ODQ= | 2893 | Dependency issue when building docs according to instructions | jbusecke 14314623 | closed | 0 | 1 | 2019-04-15T17:54:35Z | 2019-04-16T03:57:28Z | 2019-04-16T03:57:28Z | CONTRIBUTOR | Code Sample, a copy-pastable example if possibleI was following the instructions to build the docs locally, using When running Extension error:
Could not import extension IPython.sphinxext.ipython_directive (exception: No module named 'IPython')
make: *** [html] Error 2
(test_env)
Should this line Or am I overlooking something? |
{
    "url": "https://api.github.com/repos/pydata/xarray/issues/2893/reactions",
    "total_count": 0,
    "+1": 0,
    "-1": 0,
    "laugh": 0,
    "hooray": 0,
    "confused": 0,
    "heart": 0,
    "rocket": 0,
    "eyes": 0
} |
completed | xarray 13221727 | issue | ||||||
| 258913450 | MDU6SXNzdWUyNTg5MTM0NTA= | 1581 | Projection issue with plot.imshow and cartopy projection | jbusecke 14314623 | closed | 0 | 4 | 2017-09-19T18:10:06Z | 2019-03-07T22:09:41Z | 2019-03-07T22:09:41Z | CONTRIBUTOR | I am experiencing some trouble when using cartopy transformations in the plot module. I am concerned about plotting speed (plotting very high resolution maps of ocean model output takes forever). According to #657 I tried to use plot.imshow but I am getting unexpected results for the map projection. The longitude wrapping does not seem to work and as seen by the mismatch between the ocean mask data and the coastline in the example below, the projection seems to be inaccurate. This seems to be related to the cartopy module (see the last plot which was done 'outside' of xarray). My question is twofold, I guess 1) Is there is any other 'high speed' alternative to plot high resolution maps. 2) Since this error might not appear as drastically in all mapping scenarios, should plot.imshow display a warning, when invoked with a transformation argument, or even an error? ```python import xarray as xr %matplotlib inline import numpy as np import cartopy.crs as ccrs import cartopy.feature as cfeature import matplotlib.pyplot as plt ds = xr.open_dataset('ocean_mask.nc') plt.figure() ax_i = plt.gca(projection=ccrs.Robinson()) ds.wet.plot.imshow(x='lonh',y='lath',ax=ax_i,transform=ccrs.PlateCarree()) ax_i.coastlines() plt.title('imshow') plt.figure() ax_p = plt.gca(projection=ccrs.Robinson()) ds.wet.plot(x='lonh',y='lath',ax=ax_p,transform=ccrs.PlateCarree()) ax_p.coastlines() plt.title('standard plot') plt.figure() ax = plt.gca(projection=ccrs.Robinson()) ax.imshow(ds.wet.data, transform=ccrs.PlateCarree(), extent=[ds.lonh.min().data, ds.lonh.max().data,ds.lath.min().data, ds.lath.max().data]) ax.coastlines() plt.title('cartopy imshow') ```
|
{
    "url": "https://api.github.com/repos/pydata/xarray/issues/1581/reactions",
    "total_count": 0,
    "+1": 0,
    "-1": 0,
    "laugh": 0,
    "hooray": 0,
    "confused": 0,
    "heart": 0,
    "rocket": 0,
    "eyes": 0
} |
completed | xarray 13221727 | issue | ||||||
| 398041758 | MDExOlB1bGxSZXF1ZXN0MjQzODUwNjU1 | 2665 | enable internal plotting with cftime datetime | jbusecke 14314623 | closed | 0 | 28 | 2019-01-10T22:23:31Z | 2019-02-08T18:15:26Z | 2019-02-08T00:11:14Z | CONTRIBUTOR | 0 | pydata/xarray/pulls/2665 | This PR is meant to restore the internal plotting capabilities for objects with cftime.datetime dimensions. Based mostly on the discussions in #2164
|
{
    "url": "https://api.github.com/repos/pydata/xarray/issues/2665/reactions",
    "total_count": 0,
    "+1": 0,
    "-1": 0,
    "laugh": 0,
    "hooray": 0,
    "confused": 0,
    "heart": 0,
    "rocket": 0,
    "eyes": 0
} |
xarray 13221727 | pull | |||||
| 272415954 | MDU6SXNzdWUyNzI0MTU5NTQ= | 1704 | Error when using engine='scipy' reading CM2.6 ocean output | jbusecke 14314623 | closed | 0 | 7 | 2017-11-09T02:06:00Z | 2019-01-22T22:48:21Z | 2019-01-22T22:48:21Z | CONTRIBUTOR | Code Sample, a copy-pastable example if possible
```ValueError Traceback (most recent call last) <ipython-input-7-278556ff881c> in <module>() 1 path = '/work/Julius.Busecke/CM2.6_staged/CM2.6_A_V03_1PctTo2X/annual_averages' ----> 2 ds_ocean = xr.open_mfdataset(os.path.join(path,'ocean.*.ann.nc'), chunks={'time':1}, decode_times=False, engine='scipy') 3 ds_ocean ~/code/miniconda/envs/standard/lib/python3.6/site-packages/xarray/backends/api.py in open_mfdataset(paths, chunks, concat_dim, compat, preprocess, engine, lock, kwargs) 503 lock = _default_lock(paths[0], engine) 504 datasets = [open_dataset(p, engine=engine, chunks=chunks or {}, lock=lock, --> 505 kwargs) for p in paths] 506 file_objs = [ds._file_obj for ds in datasets] 507 ~/code/miniconda/envs/standard/lib/python3.6/site-packages/xarray/backends/api.py in <listcomp>(.0) 503 lock = _default_lock(paths[0], engine) 504 datasets = [open_dataset(p, engine=engine, chunks=chunks or {}, lock=lock, --> 505 **kwargs) for p in paths] 506 file_objs = [ds._file_obj for ds in datasets] 507 ~/code/miniconda/envs/standard/lib/python3.6/site-packages/xarray/backends/api.py in open_dataset(filename_or_obj, group, decode_cf, mask_and_scale, decode_times, autoclose, concat_characters, decode_coords, engine, chunks, lock, cache, drop_variables) 283 elif engine == 'scipy': 284 store = backends.ScipyDataStore(filename_or_obj, --> 285 autoclose=autoclose) 286 elif engine == 'pydap': 287 store = backends.PydapDataStore(filename_or_obj) ~/code/miniconda/envs/standard/lib/python3.6/site-packages/xarray/backends/scipy_.py in init(self, filename_or_obj, mode, format, group, writer, mmap, autoclose) 133 filename=filename_or_obj, 134 mode=mode, mmap=mmap, version=version) --> 135 self.ds = opener() 136 self._autoclose = autoclose 137 self._isopen = True ~/code/miniconda/envs/standard/lib/python3.6/site-packages/xarray/backends/scipy_.py in _open_scipy_netcdf(filename, mode, mmap, version) 81 try: 82 return scipy.io.netcdf_file(filename, mode=mode, mmap=mmap, ---> 83 version=version) 84 except TypeError as e: # netcdf3 message is obscure in this case 85 errmsg = e.args[0] ~/code/miniconda/envs/standard/lib/python3.6/site-packages/scipy/io/netcdf.py in init(self, filename, mode, mmap, version, maskandscale) 264 265 if mode in 'ra': --> 266 self._read() 267 268 def setattr(self, attr, value): ~/code/miniconda/envs/standard/lib/python3.6/site-packages/scipy/io/netcdf.py in _read(self) 591 self._read_dim_array() 592 self._read_gatt_array() --> 593 self._read_var_array() 594 595 def _read_numrecs(self): ~/code/miniconda/envs/standard/lib/python3.6/site-packages/scipy/io/netcdf.py in _read_var_array(self) 696 # Build rec array. 697 if self.use_mmap: --> 698 rec_array = self._mm_buf[begin:begin+self._recs*self._recsize].view(dtype=dtypes) 699 rec_array.shape = (self._recs,) 700 else: ValueError: new type not compatible with array. ``` xarray version: '0.9.6' Problem descriptionI am trying to lazily read in a large number of high resolution ocean model output files. If I omit the I found #1313, and checked my conda environment: ``` $ conda list hdf packages in environment at /home/Julius.Busecke/code/miniconda/envs/standard:hdf4 4.2.12 0 conda-forge
hdf5 1.8.18 1 conda-forge
packages in environment at /home/Julius.Busecke/code/miniconda/envs/standard:h5netcdf 0.4.2 py_0 conda-forge
libnetcdf 4.4.1.1 6 conda-forge
netcdf4 1.3.0 py36_0 conda-forge
I keep getting this error with some of the files for this particular model but not with others. Any help would be greatly appreciated. |
{
    "url": "https://api.github.com/repos/pydata/xarray/issues/1704/reactions",
    "total_count": 0,
    "+1": 0,
    "-1": 0,
    "laugh": 0,
    "hooray": 0,
    "confused": 0,
    "heart": 0,
    "rocket": 0,
    "eyes": 0
} |
completed | xarray 13221727 | issue | ||||||
| 356067160 | MDU6SXNzdWUzNTYwNjcxNjA= | 2394 | Change default colormaps | jbusecke 14314623 | closed | 0 | 3 | 2018-08-31T17:38:08Z | 2018-09-05T15:17:23Z | 2018-09-05T15:17:23Z | CONTRIBUTOR | Problem descriptionxarrays plotting module is awesome because it detects automatically if the data is divergent or not and adjusts the colormap accordingly. But what if I do not particularly like the default colormap choice for either data type (e.g. my current boss is not a fan of matplotlibs viridis)? @shoyer mentioned on stackexchange that this is not currently possible. I would be happy to submit a PR, if I can get some guidance on where to implement this. What does everyone think about a syntax this shoule be implemented with? Something like:
|
{
    "url": "https://api.github.com/repos/pydata/xarray/issues/2394/reactions",
    "total_count": 0,
    "+1": 0,
    "-1": 0,
    "laugh": 0,
    "hooray": 0,
    "confused": 0,
    "heart": 0,
    "rocket": 0,
    "eyes": 0
} |
completed | xarray 13221727 | issue | ||||||
| 356546301 | MDExOlB1bGxSZXF1ZXN0MjEyNzgwMjUy | 2397 | add options for nondivergent and divergent cmap | jbusecke 14314623 | closed | 0 | 6 | 2018-09-03T15:31:26Z | 2018-09-05T15:17:23Z | 2018-09-05T15:17:23Z | CONTRIBUTOR | 0 | pydata/xarray/pulls/2397 |
|
{
    "url": "https://api.github.com/repos/pydata/xarray/issues/2397/reactions",
    "total_count": 0,
    "+1": 0,
    "-1": 0,
    "laugh": 0,
    "hooray": 0,
    "confused": 0,
    "heart": 0,
    "rocket": 0,
    "eyes": 0
} |
xarray 13221727 | pull | |||||
| 265013667 | MDU6SXNzdWUyNjUwMTM2Njc= | 1630 | Option to include units in .plot() | jbusecke 14314623 | closed | 0 | 2 | 2017-10-12T16:53:57Z | 2018-06-12T00:33:49Z | 2018-06-12T00:33:23Z | CONTRIBUTOR | I find myself editing the label on the colorbar of xarray plots often to include the units of the plotted variable. Would it be possible to extract the value of DataArray.attrs['units] (if present) and add it to the colorbar label? Given an example DataArray with name='temperature' and attrs['units']='deg C', the current colorbar label says 'temperature'. A 'plot_units' keyword could possibly be used like this for example:
|
{
    "url": "https://api.github.com/repos/pydata/xarray/issues/1630/reactions",
    "total_count": 4,
    "+1": 4,
    "-1": 0,
    "laugh": 0,
    "hooray": 0,
    "confused": 0,
    "heart": 0,
    "rocket": 0,
    "eyes": 0
} |
completed | xarray 13221727 | issue | ||||||
| 271957479 | MDU6SXNzdWUyNzE5NTc0Nzk= | 1695 | Diagnose groupby/groupby_bins issues | jbusecke 14314623 | closed | 0 | 3 | 2017-11-07T19:39:38Z | 2017-11-09T16:36:26Z | 2017-11-09T16:36:19Z | CONTRIBUTOR | Code Sample, a copy-pastable example if possible```python import xarray as xr xr.version
ds = xr.open_dataset('../testing/Bianchi_o2.nc',chunks={'TIME':1}) ds
This runs as expectedds.isel(TIME=0).groupby_bins('O2_LINEAR', np.array([0,20,40,60,100])).max() This crashes the kernelds.groupby_bins('O2_LINEAR', np.array([0,20,40,60,100])).max() ``` Problem descriptionI am working on ocean oxygen data and would like to compute the volume of the ocean contained within a range of concentration values. I am trying to use groupby_bins but even with this modest size dataset (1 deg global resolution, 25 depth levels, 12 time steps) my kernel crashes every time without any error message. I eventually want to perform this step on several TB of ocean model output, so this is concerning. First of all I would like to ask if there is an easy way to diagnose the problem further. And secondly, are there recommendations how to compute the sum over groupby_bins for very large datasets (consisting out of dask arrays). |
{
    "url": "https://api.github.com/repos/pydata/xarray/issues/1695/reactions",
    "total_count": 0,
    "+1": 0,
    "-1": 0,
    "laugh": 0,
    "hooray": 0,
    "confused": 0,
    "heart": 0,
    "rocket": 0,
    "eyes": 0
} |
completed | xarray 13221727 | issue | ||||||
| 199218465 | MDU6SXNzdWUxOTkyMTg0NjU= | 1195 | Bug in dateconversion? | jbusecke 14314623 | closed | 0 | 4 | 2017-01-06T15:25:03Z | 2017-01-09T14:27:18Z | 2017-01-09T14:27:18Z | CONTRIBUTOR | I noticed an undesired behavior in xarray when using xarray.open_dataset: running the following in version 0.8.2-90-g2c7730d:
Note the hour is 19, I also encountered files with 20. Since the time in the .nc file is given in 'days since', the expected output would be 00. Indeed when running version 0.8.2 the output is:
Sample file used in the example can be found here: https://ufile.io/077da |
{
    "url": "https://api.github.com/repos/pydata/xarray/issues/1195/reactions",
    "total_count": 0,
    "+1": 0,
    "-1": 0,
    "laugh": 0,
    "hooray": 0,
    "confused": 0,
    "heart": 0,
    "rocket": 0,
    "eyes": 0
} |
completed | xarray 13221727 | issue | ||||||
| 194370559 | MDU6SXNzdWUxOTQzNzA1NTk= | 1159 | Problem passing 'norm' when plotting a faceted figure | jbusecke 14314623 | closed | 0 | 3 | 2016-12-08T15:49:00Z | 2016-12-09T14:08:49Z | 2016-12-09T09:46:58Z | CONTRIBUTOR | I am not sure if this is a bug or user error by me. I am basically trying to pass a SymLogNorm to all plots in a faceted plot, but it has no effect. It works when I just plot a single axis. Below I reproduced the effect with an example dataset. Matplotlib version: 1.5.1 xarray version: 0.8.2 ```python import xarray as xr import matplotlib as mpl Here the passed 'norm=' keyword has the desired effectda1 = xr.DataArray(np.random.exponential(size=[10,10])) plt.figure() da1.plot() plt.figure() da1.plot(norm=mpl.colors.SymLogNorm(0.1)) In the faceted plot this has no effectda2 = xr.DataArray(np.random.exponential(size=[10,10,4])) plt.figure() da.plot(x='dim_0',y='dim_1',col='dim_2',col_wrap=2) plt.figure() da.plot(x='dim_0',y='dim_1',col='dim_2',col_wrap=3,norm=mpl.colors.SymLogNorm(0.1)) ``` |
{
    "url": "https://api.github.com/repos/pydata/xarray/issues/1159/reactions",
    "total_count": 0,
    "+1": 0,
    "-1": 0,
    "laugh": 0,
    "hooray": 0,
    "confused": 0,
    "heart": 0,
    "rocket": 0,
    "eyes": 0
} |
completed | xarray 13221727 | issue |


 which is the coordinate padding I need.


Advanced export
JSON shape: default, array, newline-delimited, object
CREATE TABLE [issues] (
   [id] INTEGER PRIMARY KEY,
   [node_id] TEXT,
   [number] INTEGER,
   [title] TEXT,
   [user] INTEGER REFERENCES [users]([id]),
   [state] TEXT,
   [locked] INTEGER,
   [assignee] INTEGER REFERENCES [users]([id]),
   [milestone] INTEGER REFERENCES [milestones]([id]),
   [comments] INTEGER,
   [created_at] TEXT,
   [updated_at] TEXT,
   [closed_at] TEXT,
   [author_association] TEXT,
   [active_lock_reason] TEXT,
   [draft] INTEGER,
   [pull_request] TEXT,
   [body] TEXT,
   [reactions] TEXT,
   [performed_via_github_app] TEXT,
   [state_reason] TEXT,
   [repo] INTEGER REFERENCES [repos]([id]),
   [type] TEXT
);
CREATE INDEX [idx_issues_repo]
    ON [issues] ([repo]);
CREATE INDEX [idx_issues_milestone]
    ON [issues] ([milestone]);
CREATE INDEX [idx_issues_assignee]
    ON [issues] ([assignee]);
CREATE INDEX [idx_issues_user]
    ON [issues] ([user]);