issues
8 rows where repo = 13221727, state = "open" and user = 14314623 sorted by updated_at descending
This data as json, CSV (advanced)
Suggested facets: comments, created_at (date), updated_at (date)
| id | node_id | number | title | user | state | locked | assignee | milestone | comments | created_at | updated_at ▲ | closed_at | author_association | active_lock_reason | draft | pull_request | body | reactions | performed_via_github_app | state_reason | repo | type |
|---|---|---|---|---|---|---|---|---|---|---|---|---|---|---|---|---|---|---|---|---|---|---|
| 977544678 | MDU6SXNzdWU5Nzc1NDQ2Nzg= | 5733 | Shoudn't `assert_allclose` transpose datasets? | jbusecke 14314623 | open | 0 | 16 | 2021-08-23T22:55:12Z | 2024-05-01T15:27:21Z | CONTRIBUTOR | I am trying to compare two datasets, one of which has possibly transposed dimensions on a data variable.
```AssertionError Traceback (most recent call last) <ipython-input-7-58cd53174a1e> in <module> ----> 1 xr.testing.assert_allclose(ds1, ds2) /srv/conda/envs/notebook/lib/python3.8/site-packages/xarray/testing.py in assert_allclose(a, b, rtol, atol, decode_bytes) 169 a.variables, b.variables, compat=compat_variable 170 ) --> 171 assert allclose, formatting.diff_dataset_repr(a, b, compat=equiv) 172 else: 173 raise TypeError("{} not supported by assertion comparison".format(type(a))) AssertionError: Left and right Dataset objects are not close Differing data variables: L data (x, y) float64 0.8589 0.09264 0.0264 ... 0.1039 0.3685 0.3983 R data (y, x) float64 0.8589 0.8792 0.8433 0.6952 ... 0.3664 0.2214 0.3983 ``` Simply transposing
Since most of the other xarray operations are 'transpose-safe' ( Environment: Output of <tt>xr.show_versions()</tt>INSTALLED VERSIONS ------------------ commit: None python: 3.8.8 | packaged by conda-forge | (default, Feb 20 2021, 16:22:27) [GCC 9.3.0] python-bits: 64 OS: Linux OS-release: 5.4.109+ machine: x86_64 processor: x86_64 byteorder: little LC_ALL: C.UTF-8 LANG: C.UTF-8 LOCALE: ('en_US', 'UTF-8') libhdf5: 1.10.6 libnetcdf: 4.7.4 xarray: 0.19.0 pandas: 1.2.4 numpy: 1.20.2 scipy: 1.6.2 netCDF4: 1.5.6 pydap: installed h5netcdf: 0.11.0 h5py: 3.2.1 Nio: None zarr: 2.7.1 cftime: 1.4.1 nc_time_axis: 1.2.0 PseudoNetCDF: None rasterio: 1.2.2 cfgrib: 0.9.9.0 iris: None bottleneck: 1.3.2 dask: 2021.04.1 distributed: 2021.04.1 matplotlib: 3.4.1 cartopy: 0.19.0 seaborn: None numbagg: None pint: 0.17 setuptools: 49.6.0.post20210108 pip: 20.3.4 conda: None pytest: None IPython: 7.22.0 sphinx: None |
{
    "url": "https://api.github.com/repos/pydata/xarray/issues/5733/reactions",
    "total_count": 0,
    "+1": 0,
    "-1": 0,
    "laugh": 0,
    "hooray": 0,
    "confused": 0,
    "heart": 0,
    "rocket": 0,
    "eyes": 0
} |
xarray 13221727 | issue | ||||||||
| 1755610168 | I_kwDOAMm_X85opHw4 | 7918 | xarray lazy indexing/loading is not sufficiently documented | jbusecke 14314623 | open | 0 | 1 | 2023-06-13T20:35:38Z | 2023-06-13T21:29:53Z | CONTRIBUTOR | What is your issue?The default behavior of opening up datasets lazily instead of loading them into memory urgently needs more documentation or more extensive linking of existing docs. I have seen tons of example where the 'laziness' of the loading is not apparent to users. The workflow commonly looks something like this:
1. Open some 'larger-than-memory' dataset, e.g. from a cloud bucket with To start with, the docstring of Up until a chat I had with @TomNicholas today, I honestly did not understand why this feature even existed. His explanation (below) was however very good, and if something similar is not in the docs yet, should probably be added.
I think overall this is a giant pitfall, particularly for xarray beginners, and thus deserves some thought. While I am sure the choices made up to here might have some large functional upsides, I wonder three things:
Happy to work on this, since it is very relevant for many members of projects I work with. I first wanted to check if there is some existing docs that I missed. |
{
    "url": "https://api.github.com/repos/pydata/xarray/issues/7918/reactions",
    "total_count": 0,
    "+1": 0,
    "-1": 0,
    "laugh": 0,
    "hooray": 0,
    "confused": 0,
    "heart": 0,
    "rocket": 0,
    "eyes": 0
} |
xarray 13221727 | issue | ||||||||
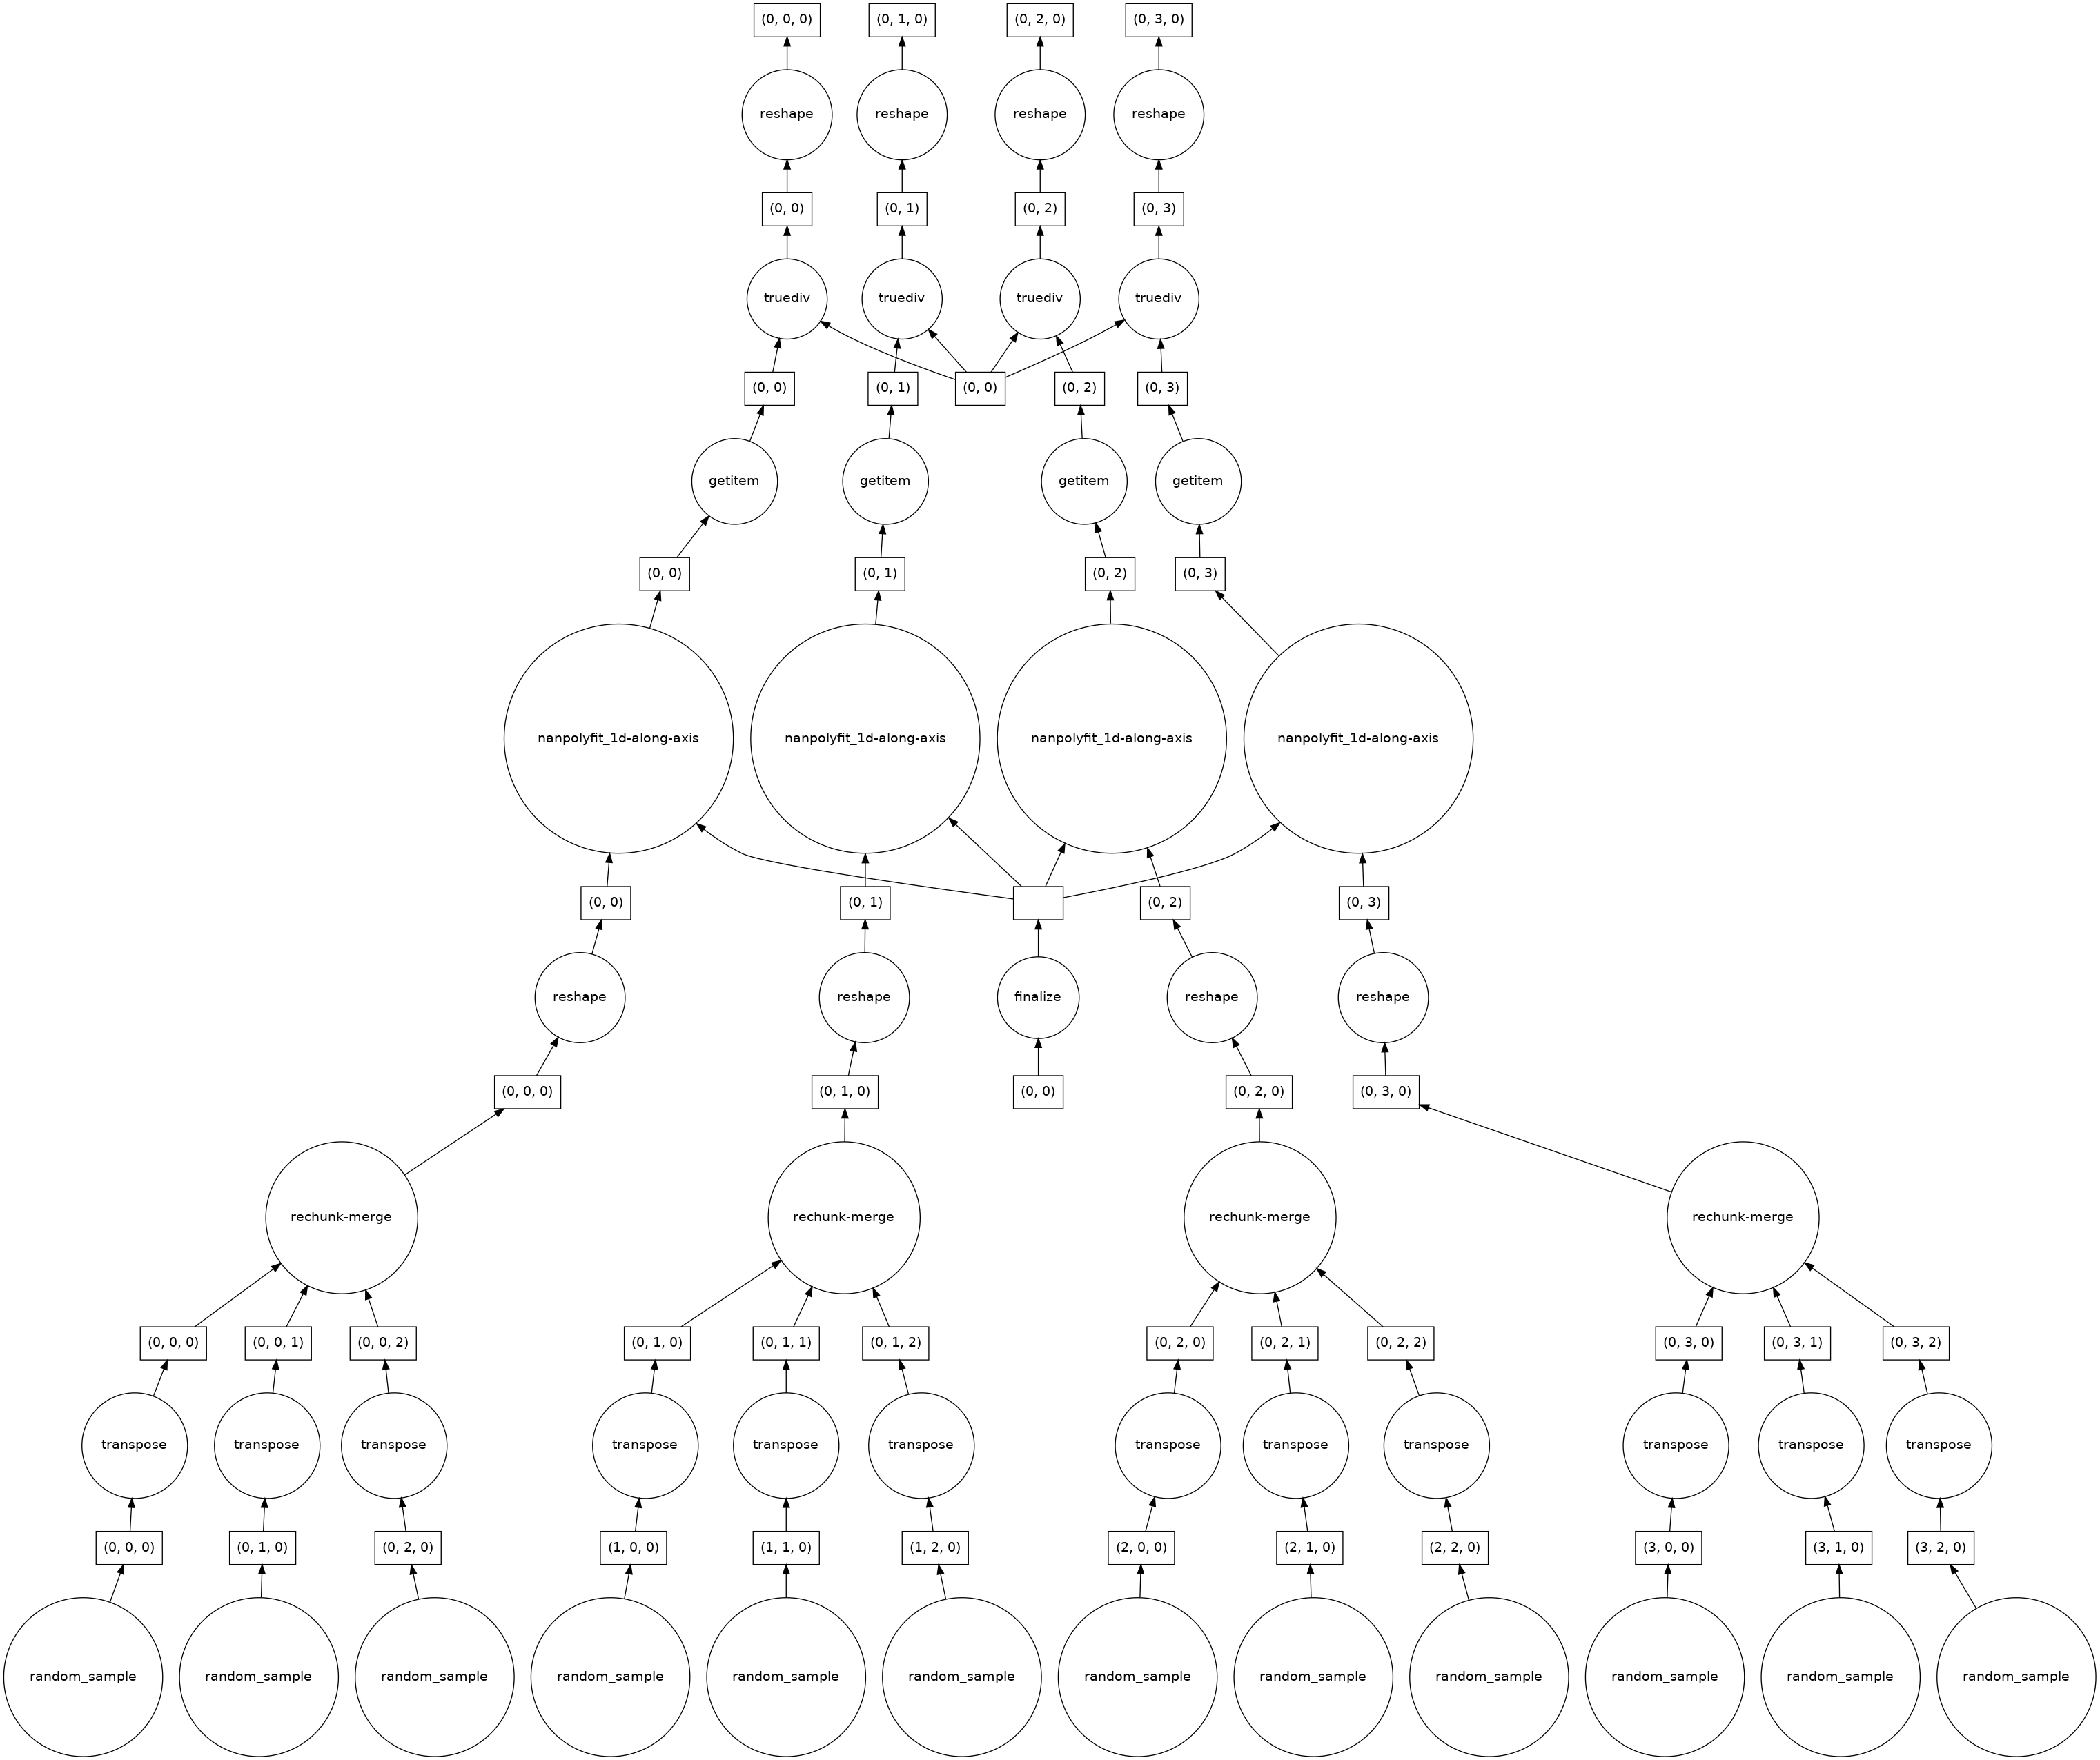
| 950882492 | MDU6SXNzdWU5NTA4ODI0OTI= | 5629 | Polyfit performance on large datasets - Suboptimal dask task graph | jbusecke 14314623 | open | 0 | 15 | 2021-07-22T17:19:52Z | 2023-01-24T20:19:19Z | CONTRIBUTOR | What happened: I am trying to calculate a linear trend over a large climate model simulation. I use rechunker to chunk the data along the horizontal dimensions and make sure that the time dimension (along which I want to calculate the fit) is not chunked. In my realistic example, this blows up the memory of my workers. What you expected to happen: I expected this to work very smoothly because it should be embarassingly parallel (no information of sourrounding chunks is needed and the time dimension is complete in each chunk). Minimal Complete Verifiable Example: I think this minimal example shows that the task graph created is not ideal
When I apply polyfit I get this
Now the number of chunks has decreased to 4? I am not sure why, but this indicates to me that my problem might be related to #4554. When I look at the task graph it seems that this explains why for very large dataset the computation blows up:
As I said before I would expect this calculation to be fully parallelizable, but there seems to be some aggregation/rechunking steps in the bottom layer. How 'bad' these get (e.g. how many input chunks get lumped together in the cc @TomNicholas Anything else we need to know?: Environment: Output of <tt>xr.show_versions()</tt>INSTALLED VERSIONS ------------------ commit: None python: 3.8.8 | packaged by conda-forge | (default, Feb 20 2021, 16:22:27) [GCC 9.3.0] python-bits: 64 OS: Linux OS-release: 5.4.89+ machine: x86_64 processor: x86_64 byteorder: little LC_ALL: C.UTF-8 LANG: C.UTF-8 LOCALE: en_US.UTF-8 libhdf5: 1.10.6 libnetcdf: 4.7.4 xarray: 0.17.0 pandas: 1.2.4 numpy: 1.20.2 scipy: 1.6.2 netCDF4: 1.5.6 pydap: installed h5netcdf: 0.11.0 h5py: 3.2.1 Nio: None zarr: 2.7.1 cftime: 1.4.1 nc_time_axis: 1.2.0 PseudoNetCDF: None rasterio: 1.2.2 cfgrib: 0.9.9.0 iris: None bottleneck: 1.3.2 dask: 2021.04.1 distributed: 2021.04.1 matplotlib: 3.4.1 cartopy: 0.19.0 seaborn: None numbagg: None pint: 0.17 setuptools: 49.6.0.post20210108 pip: 20.3.4 conda: None pytest: None IPython: 7.22.0 sphinx: None |
{
    "url": "https://api.github.com/repos/pydata/xarray/issues/5629/reactions",
    "total_count": 0,
    "+1": 0,
    "-1": 0,
    "laugh": 0,
    "hooray": 0,
    "confused": 0,
    "heart": 0,
    "rocket": 0,
    "eyes": 0
} |
xarray 13221727 | issue | ||||||||
| 956259734 | MDU6SXNzdWU5NTYyNTk3MzQ= | 5649 | xr.merge bug? when using combine_attrs='drop_conflicts' | jbusecke 14314623 | open | 0 | keewis 14808389 | 3 | 2021-07-29T22:47:43Z | 2022-04-09T03:14:24Z | CONTRIBUTOR | What happened: I have recently encountered a situation where combining two datasets failed, due to the datatype of their attributes. This example illustrates the situation: ```python ds1 = xr.Dataset(attrs={'a':[5]}) ds2 = xr.Dataset(attrs={'a':6}) xr.merge([ds1, ds2], combine_attrs='drop_conflicts')
TypeError Traceback (most recent call last) <ipython-input-12-1c8e82be0882> in <module> 2 ds2 = xr.Dataset(attrs={'a':6}) 3 ----> 4 xr.merge([ds1, ds2], combine_attrs='drop_conflicts') /srv/conda/envs/notebook/lib/python3.8/site-packages/xarray/core/merge.py in merge(objects, compat, join, fill_value, combine_attrs) 898 dict_like_objects.append(obj) 899 --> 900 merge_result = merge_core( 901 dict_like_objects, 902 compat, /srv/conda/envs/notebook/lib/python3.8/site-packages/xarray/core/merge.py in merge_core(objects, compat, join, combine_attrs, priority_arg, explicit_coords, indexes, fill_value) 654 ) 655 --> 656 attrs = merge_attrs( 657 [var.attrs for var in coerced if isinstance(var, (Dataset, DataArray))], 658 combine_attrs, /srv/conda/envs/notebook/lib/python3.8/site-packages/xarray/core/merge.py in merge_attrs(variable_attrs, combine_attrs, context) 544 } 545 ) --> 546 result = { 547 key: value 548 for key, value in result.items() /srv/conda/envs/notebook/lib/python3.8/site-packages/xarray/core/merge.py in <dictcomp>(.0) 547 key: value 548 for key, value in result.items() --> 549 if key not in attrs or equivalent(attrs[key], value) 550 } 551 dropped_keys |= {key for key in attrs if key not in result} /srv/conda/envs/notebook/lib/python3.8/site-packages/xarray/core/utils.py in equivalent(first, second) 171 return duck_array_ops.array_equiv(first, second) 172 elif isinstance(first, list) or isinstance(second, list): --> 173 return list_equiv(first, second) 174 else: 175 return ( /srv/conda/envs/notebook/lib/python3.8/site-packages/xarray/core/utils.py in list_equiv(first, second) 182 def list_equiv(first, second): 183 equiv = True --> 184 if len(first) != len(second): 185 return False 186 else: TypeError: object of type 'int' has no len() ``` Took me a while to find out what the root cause of this was with a fully populated dataset, since the error is less than obvious. What you expected to happen:
In my understanding this should just drop the attribute Is there a way to handle this case more elegantly? Output of <tt>xr.show_versions()</tt>INSTALLED VERSIONS ------------------ commit: None python: 3.8.8 | packaged by conda-forge | (default, Feb 20 2021, 16:22:27) [GCC 9.3.0] python-bits: 64 OS: Linux OS-release: 5.4.89+ machine: x86_64 processor: x86_64 byteorder: little LC_ALL: C.UTF-8 LANG: C.UTF-8 LOCALE: ('en_US', 'UTF-8') libhdf5: 1.10.6 libnetcdf: 4.7.4 xarray: 0.19.1.dev8+gda99a566 pandas: 1.2.4 numpy: 1.20.2 scipy: 1.6.2 netCDF4: 1.5.6 pydap: installed h5netcdf: 0.11.0 h5py: 3.2.1 Nio: None zarr: 2.7.1 cftime: 1.4.1 nc_time_axis: 1.2.0 PseudoNetCDF: None rasterio: 1.2.2 cfgrib: 0.9.9.0 iris: None bottleneck: 1.3.2 dask: 2021.04.1 distributed: 2021.04.1 matplotlib: 3.4.1 cartopy: 0.19.0 seaborn: None numbagg: None pint: 0.17 setuptools: 49.6.0.post20210108 pip: 20.3.4 conda: None pytest: None IPython: 7.22.0 sphinx: None |
{
    "url": "https://api.github.com/repos/pydata/xarray/issues/5649/reactions",
    "total_count": 1,
    "+1": 1,
    "-1": 0,
    "laugh": 0,
    "hooray": 0,
    "confused": 0,
    "heart": 0,
    "rocket": 0,
    "eyes": 0
} |
xarray 13221727 | issue | |||||||
| 1185232773 | I_kwDOAMm_X85GpTeF | 6425 | Expose `coord_mode` in `.pad()` | jbusecke 14314623 | open | 0 | 1 | 2022-03-29T18:06:35Z | 2022-03-30T09:19:05Z | CONTRIBUTOR | Is your feature request related to a problem?I am experiencing some issues with the way coordinates are padded. Currently the coordinates are padded according to the A simple example: ```python import xarray as xr import numpy as np da = xr.DataArray([1,2,3], dims=['x'], coords={'x':[4,5,6]})
da
```
If I pad with But if I pad with Describe the solution you'd likeI would like to be able to do something like this:
Since #3596 internally already defines Possibly related (but I think not incompatible with the changes propsed here?): #3868 Happy to work with @TomNicholas on a PR, but wanted to get some feedback/comments first. cc @dcherian @mark-boer who worked on this code. Describe alternatives you've consideredNo response Additional contextNo response |
{
    "url": "https://api.github.com/repos/pydata/xarray/issues/6425/reactions",
    "total_count": 0,
    "+1": 0,
    "-1": 0,
    "laugh": 0,
    "hooray": 0,
    "confused": 0,
    "heart": 0,
    "rocket": 0,
    "eyes": 0
} |
xarray 13221727 | issue | ||||||||
| 830638672 | MDU6SXNzdWU4MzA2Mzg2NzI= | 5030 | `missing_dims` option for aggregation methods like `mean` and `std` | jbusecke 14314623 | open | 0 | 5 | 2021-03-12T23:12:08Z | 2022-03-03T22:37:16Z | CONTRIBUTOR | I work a lot with climate model output and often loop over several models, of which some have a 'member' dimension and others don't. I end up writing many lines like this:
I recently noticed that I'd love to be able to do:
|
{
    "url": "https://api.github.com/repos/pydata/xarray/issues/5030/reactions",
    "total_count": 0,
    "+1": 0,
    "-1": 0,
    "laugh": 0,
    "hooray": 0,
    "confused": 0,
    "heart": 0,
    "rocket": 0,
    "eyes": 0
} |
xarray 13221727 | issue | ||||||||
| 627600168 | MDU6SXNzdWU2Mjc2MDAxNjg= | 4112 | Unexpected chunking behavior when using `xr.align` with `join='outer'` | jbusecke 14314623 | open | 0 | 6 | 2020-05-29T23:46:31Z | 2020-10-06T20:20:34Z | CONTRIBUTOR | I just came across some unexpected behavior, when using MCVE Code Sample```python import numpy as np import xarray as xr short_time = xr.cftime_range('2000', periods=12) long_time = xr.cftime_range('2000', periods=120) data_short = np.random.rand(len(short_time)) data_long = np.random.rand(len(long_time)) a = xr.DataArray(data_short, dims=['time'], coords={'time':short_time}).chunk({'time':3}) b = xr.DataArray(data_long, dims=['time'], coords={'time':long_time}).chunk({'time':3}) a,b = xr.align(a,b, join = 'outer') ``` Expected OutputAs expected But the filled values do not replicate the chunking along the time dimension in
(Quick shoutout for the amazing html representation. This made diagnosing this problem super easy! 🥳 ) Problem DescriptionI think for many problems it would be more appropriate if the padded portion of the array would have a chunking scheme like the longer array. A practical example (which brought me to this issue) is given in the CMIP6 data archive, where some models give output for several members, with some of them running longer than others, leading to problems when these are combined (see intake-esm/#225).
Basically for that particular model, there are 5 members with a runtime of 100 years and one member with a runtime of 300 years. I think using Is there a way to work around this, or is this behavior intended and I am missing something? cc'ing @dcherian @andersy005 VersionsOutput of <tt>xr.show_versions()</tt>INSTALLED VERSIONS ------------------ commit: None python: 3.8.2 | packaged by conda-forge | (default, Apr 24 2020, 08:20:52) [GCC 7.3.0] python-bits: 64 OS: Linux OS-release: 3.10.0-1127.el7.x86_64 machine: x86_64 processor: x86_64 byteorder: little LC_ALL: None LANG: en_US.UTF-8 LOCALE: en_US.UTF-8 libhdf5: 1.10.5 libnetcdf: 4.7.4 xarray: 0.15.1 pandas: 1.0.3 numpy: 1.18.4 scipy: 1.4.1 netCDF4: 1.5.3 pydap: None h5netcdf: 0.8.0 h5py: 2.10.0 Nio: None zarr: 2.4.0 cftime: 1.1.2 nc_time_axis: 1.2.0 PseudoNetCDF: None rasterio: 1.1.3 cfgrib: None iris: None bottleneck: None dask: 2.15.0 distributed: 2.15.2 matplotlib: 3.2.1 cartopy: 0.18.0 seaborn: None numbagg: None setuptools: 46.1.3.post20200325 pip: 20.1 conda: None pytest: 5.4.2 IPython: 7.14.0 sphinx: None |
{
    "url": "https://api.github.com/repos/pydata/xarray/issues/4112/reactions",
    "total_count": 0,
    "+1": 0,
    "-1": 0,
    "laugh": 0,
    "hooray": 0,
    "confused": 0,
    "heart": 0,
    "rocket": 0,
    "eyes": 0
} |
xarray 13221727 | issue | ||||||||
| 447361330 | MDU6SXNzdWU0NDczNjEzMzA= | 2982 | cbar_kwargs are ignored for `plot.contourf` | jbusecke 14314623 | open | 0 | 3 | 2019-05-22T21:57:24Z | 2019-05-30T00:36:17Z | CONTRIBUTOR | Code Sample, a copy-pastable example if possibleI just stumbled on some weird behaviour, possibly a bug. When plotting with the ```python import numpy as np import xarray as xr %matplotlib inline test_data = np.random.rand(10, 10)
da = xr.DataArray(test_data)
h = da.plot.contourf(vmax=0.5, cbar_kwargs={"extend": "neither"})
print(h.colorbar.extend)
```
When doing a similar plot with matplotlib this happens ``` matplotlib exampleimport matplotlib.pyplot as plt
ha = plt.contourf(test_data, vmax=0.3)
cb = plt.colorbar(ha, extend='neither')
```
Is xarray adjusting the colorbar to the This makes it especially hard to produce movies with (e.g. xmovie) because the colorbar If someone could point me to the right location in the code and tests, I would be happy to put together a PR. Output of
|
{
    "url": "https://api.github.com/repos/pydata/xarray/issues/2982/reactions",
    "total_count": 0,
    "+1": 0,
    "-1": 0,
    "laugh": 0,
    "hooray": 0,
    "confused": 0,
    "heart": 0,
    "rocket": 0,
    "eyes": 0
} |
xarray 13221727 | issue |


 which is the coordinate padding I need.


Advanced export
JSON shape: default, array, newline-delimited, object
CREATE TABLE [issues] (
   [id] INTEGER PRIMARY KEY,
   [node_id] TEXT,
   [number] INTEGER,
   [title] TEXT,
   [user] INTEGER REFERENCES [users]([id]),
   [state] TEXT,
   [locked] INTEGER,
   [assignee] INTEGER REFERENCES [users]([id]),
   [milestone] INTEGER REFERENCES [milestones]([id]),
   [comments] INTEGER,
   [created_at] TEXT,
   [updated_at] TEXT,
   [closed_at] TEXT,
   [author_association] TEXT,
   [active_lock_reason] TEXT,
   [draft] INTEGER,
   [pull_request] TEXT,
   [body] TEXT,
   [reactions] TEXT,
   [performed_via_github_app] TEXT,
   [state_reason] TEXT,
   [repo] INTEGER REFERENCES [repos]([id]),
   [type] TEXT
);
CREATE INDEX [idx_issues_repo]
    ON [issues] ([repo]);
CREATE INDEX [idx_issues_milestone]
    ON [issues] ([milestone]);
CREATE INDEX [idx_issues_assignee]
    ON [issues] ([assignee]);
CREATE INDEX [idx_issues_user]
    ON [issues] ([user]);