issue_comments
2 rows where issue = 309481761 sorted by updated_at descending
This data as json, CSV (advanced)
Suggested facets: created_at (date), updated_at (date)
issue 1
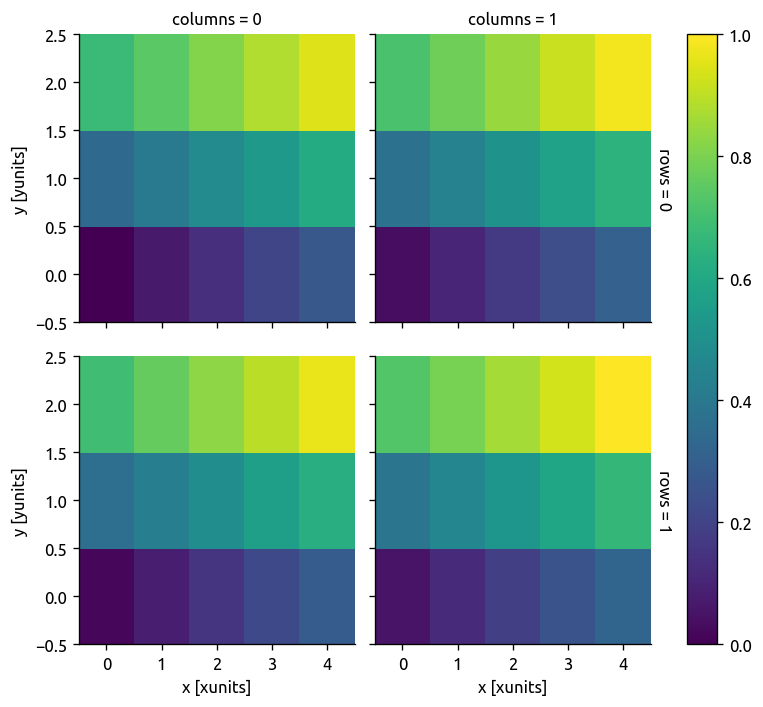
- multiple facetgrid.map calls screw up colorbar · 2 ✖
| id | html_url | issue_url | node_id | user | created_at | updated_at ▲ | author_association | body | reactions | performed_via_github_app | issue |
|---|---|---|---|---|---|---|---|---|---|---|---|
| 423919063 | https://github.com/pydata/xarray/issues/2024#issuecomment-423919063 | https://api.github.com/repos/pydata/xarray/issues/2024 | MDEyOklzc3VlQ29tbWVudDQyMzkxOTA2Mw== | dcherian 2448579 | 2018-09-24T09:27:18Z | 2018-09-24T09:27:18Z | MEMBER | There's a bigger issue:
After #2435, the result is good.
|
{
    "total_count": 0,
    "+1": 0,
    "-1": 0,
    "laugh": 0,
    "hooray": 0,
    "confused": 0,
    "heart": 0,
    "rocket": 0,
    "eyes": 0
} |
multiple facetgrid.map calls screw up colorbar 309481761 | |
| 377064127 | https://github.com/pydata/xarray/issues/2024#issuecomment-377064127 | https://api.github.com/repos/pydata/xarray/issues/2024 | MDEyOklzc3VlQ29tbWVudDM3NzA2NDEyNw== | shoyer 1217238 | 2018-03-28T22:52:35Z | 2018-03-28T22:52:35Z | MEMBER | Hmm. I wonder if it helps to use |
{
    "total_count": 0,
    "+1": 0,
    "-1": 0,
    "laugh": 0,
    "hooray": 0,
    "confused": 0,
    "heart": 0,
    "rocket": 0,
    "eyes": 0
} |
multiple facetgrid.map calls screw up colorbar 309481761 |


Advanced export
JSON shape: default, array, newline-delimited, object
CREATE TABLE [issue_comments] (
   [html_url] TEXT,
   [issue_url] TEXT,
   [id] INTEGER PRIMARY KEY,
   [node_id] TEXT,
   [user] INTEGER REFERENCES [users]([id]),
   [created_at] TEXT,
   [updated_at] TEXT,
   [author_association] TEXT,
   [body] TEXT,
   [reactions] TEXT,
   [performed_via_github_app] TEXT,
   [issue] INTEGER REFERENCES [issues]([id])
);
CREATE INDEX [idx_issue_comments_issue]
    ON [issue_comments] ([issue]);
CREATE INDEX [idx_issue_comments_user]
    ON [issue_comments] ([user]);
user 2