issue_comments: 423919063
This data as json
| html_url | issue_url | id | node_id | user | created_at | updated_at | author_association | body | reactions | performed_via_github_app | issue |
|---|---|---|---|---|---|---|---|---|---|---|---|
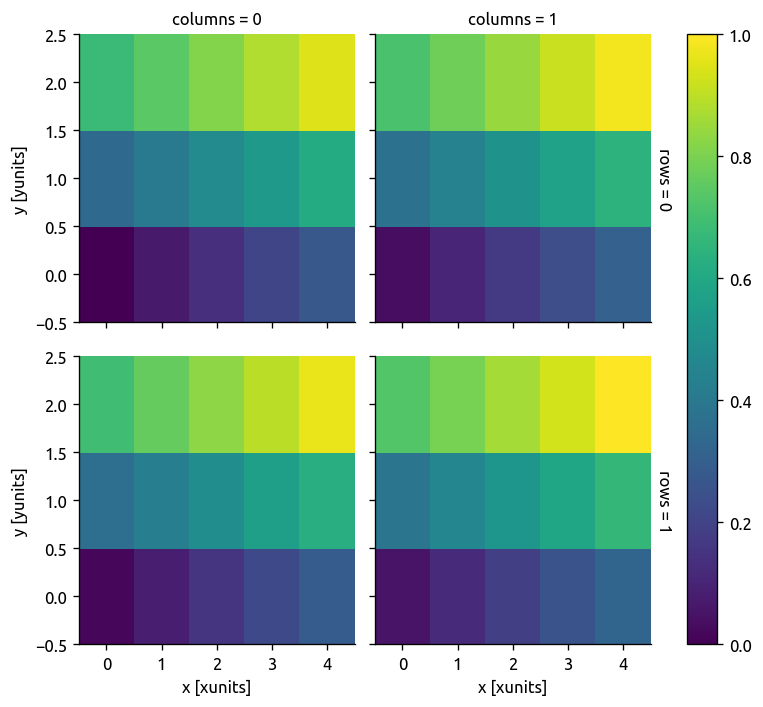
| https://github.com/pydata/xarray/issues/2024#issuecomment-423919063 | https://api.github.com/repos/pydata/xarray/issues/2024 | 423919063 | MDEyOklzc3VlQ29tbWVudDQyMzkxOTA2Mw== | 2448579 | 2018-09-24T09:27:18Z | 2018-09-24T09:27:18Z | MEMBER | There's a bigger issue:
After #2435, the result is good.
|
{
    "total_count": 0,
    "+1": 0,
    "-1": 0,
    "laugh": 0,
    "hooray": 0,
    "confused": 0,
    "heart": 0,
    "rocket": 0,
    "eyes": 0
} |
309481761 |