html_url,issue_url,id,node_id,user,created_at,updated_at,author_association,body,reactions,performed_via_github_app,issue
https://github.com/pydata/xarray/issues/2024#issuecomment-423919063,https://api.github.com/repos/pydata/xarray/issues/2024,423919063,MDEyOklzc3VlQ29tbWVudDQyMzkxOTA2Mw==,2448579,2018-09-24T09:27:18Z,2018-09-24T09:27:18Z,MEMBER,"There's a bigger issue:
```
shape = (3, 5, 2, 2)
d = xr.DataArray(np.linspace(0, 1, num=np.prod(shape)).reshape(shape),
dims=['y', 'x', 'columns', 'rows'],
coords={'y': np.arange(shape[0]),
'x': np.arange(shape[1]),
'columns': np.arange(shape[2]),
'rows': np.arange(shape[3])})
d.y.attrs['units'] = 'yunits'
d.x.attrs['units'] = 'xunits'
d.columns.attrs['units'] = 'cunits'
d.rows.attrs['units'] = 'runits'
```
`g = d.plot(x='x', y='y', col='columns', row='rows')`
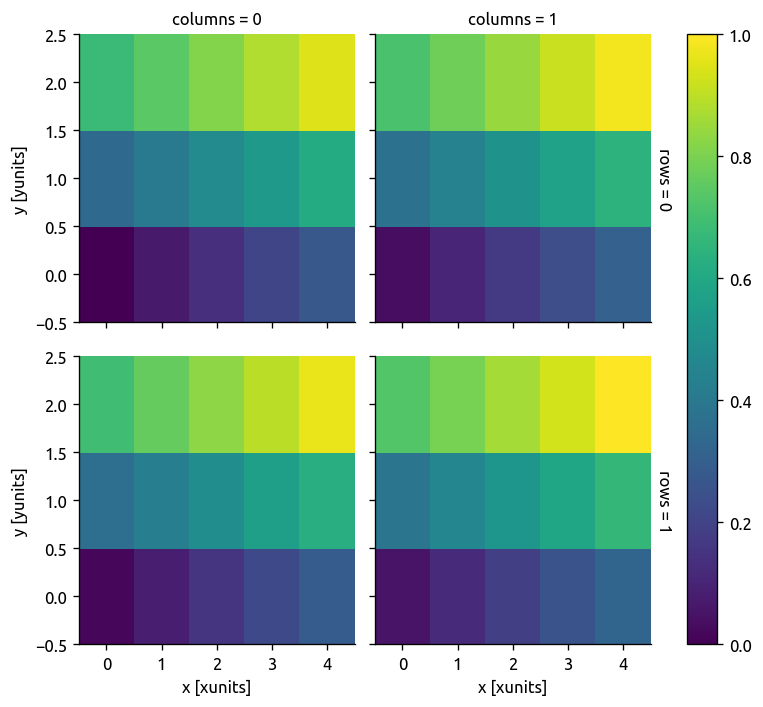
`g.map(lambda col, row: plt.plot(col, row, 'wo'), 'columns', 'rows')`
Note that the colorbar and axes-labels are now screwed up.

After #2435, the result is good.

","{""total_count"": 0, ""+1"": 0, ""-1"": 0, ""laugh"": 0, ""hooray"": 0, ""confused"": 0, ""heart"": 0, ""rocket"": 0, ""eyes"": 0}",,309481761
https://github.com/pydata/xarray/issues/2024#issuecomment-377064127,https://api.github.com/repos/pydata/xarray/issues/2024,377064127,MDEyOklzc3VlQ29tbWVudDM3NzA2NDEyNw==,1217238,2018-03-28T22:52:35Z,2018-03-28T22:52:35Z,MEMBER,Hmm. I wonder if it helps to use `add_colorbar=False` and then manually add the colorbar afterwards with the `add_colorbar()` method on the facetgrid object?,"{""total_count"": 0, ""+1"": 0, ""-1"": 0, ""laugh"": 0, ""hooray"": 0, ""confused"": 0, ""heart"": 0, ""rocket"": 0, ""eyes"": 0}",,309481761