issues
6 rows where repo = 13221727, type = "issue" and user = 12760310 sorted by updated_at descending
This data as json, CSV (advanced)
Suggested facets: comments, state_reason, created_at (date), updated_at (date), closed_at (date)
| id | node_id | number | title | user | state | locked | assignee | milestone | comments | created_at | updated_at ▲ | closed_at | author_association | active_lock_reason | draft | pull_request | body | reactions | performed_via_github_app | state_reason | repo | type |
|---|---|---|---|---|---|---|---|---|---|---|---|---|---|---|---|---|---|---|---|---|---|---|
| 1785599886 | I_kwDOAMm_X85qbheO | 7957 | `FacetGrid` plot overlaying multiple variables from same dataset? | guidocioni 12760310 | open | 0 | 1 | 2023-07-03T08:15:42Z | 2024-01-01T13:50:52Z | NONE | What is your issue?I'm trying to produce a facet plot which contains maps with different overlaid layers (e.g. a ```python p = dss['LH'].plot.pcolormesh( x='lon', y='lat', col="exp", ) for i, ax in enumerate(p.axes.flat): ax.coastlines() ax.streamplot( dss.isel(exp=i).lon.values, dss.isel(exp=i).lat.values, dss.isel(exp=i)['u_10m_gr'].values, dss.isel(exp=i)['v_10m_gr'].values, ) ``` This is far from optimal and doesn't really look clean to me. Also, I'm not entirely sure the order of All examples in the doc (https://docs.xarray.dev/en/stable/user-guide/plotting.html) refer to the However, on the doc it is mentioned
It is not clear to me whether the |
{
    "url": "https://api.github.com/repos/pydata/xarray/issues/7957/reactions",
    "total_count": 0,
    "+1": 0,
    "-1": 0,
    "laugh": 0,
    "hooray": 0,
    "confused": 0,
    "heart": 0,
    "rocket": 0,
    "eyes": 0
} |
xarray 13221727 | issue | ||||||||
| 419945711 | MDU6SXNzdWU0MTk5NDU3MTE= | 2806 | Dask arrays from `open_mfdataset` not loading when plotting inside a `multiprocessing` instance | guidocioni 12760310 | closed | 0 | 1 | 2019-03-12T11:54:44Z | 2023-12-02T02:43:30Z | 2023-12-02T02:43:30Z | NONE | Code SampleUnfortunately I cannot include the original data, as it is quite large, but I can make an accessible dropbox folder if needed. ```python debug = False if not debug: import matplotlib matplotlib.use('Agg') import matplotlib.pyplot as plt import xarray as xr import metpy.calc as mpcalc from metpy.units import units from glob import glob import numpy as np import pandas as pd from multiprocessing import Pool from functools import partial import os from utils import * import sys variable_name = 'cape_cin' projections = ['de','it','nord'] def main(): """In the main function we basically read the files and prepare the variables to be plotted. This is not included in utils.py as it can change from case to case.""" files = glob(input_file) dset = xr.open_mfdataset(files) # Only take hourly data dset = dset.sel(time=pd.date_range(dset.time[0].values, dset.time[-1].values, freq='H')) # Parse metadata for metpy dset = dset.metpy.parse_cf() # Select variable cape = dset['CAPE_ML'].squeeze().load() def plot_files(dates, **args): first = True for date in dates: # Find index in the original array to subset when plotting i = np.argmin(np.abs(date - args['time'])) # Build the name of the output image filename = subfolder_images[args['projection']]+'/'+variable_name+'_%s.png' % args['cum_hour'] if name == "main": main() ``` Problem descriptionMy task is to routinely plot output from weather models in an automatized way. The main driver script is written in 'bash' and calls different 'python' scripts at the same time. Given that the input data is always dimensioned '(time, level, latitude, longitude)' and that I have to do one plot per timestep it seemed natural to me to use This works fine if I load the input More specifically. if I remove the In theory I would like to keep the It may well be that my code is somehow malformed but as far as I know this should not be the expected behaviour. Please apologize if I'm doing something wrong; every suggestion is highly appreciated! Thought that I report the error as I found it to be non-expected behaviour. Expected OutputArray should load into memory when plotting without the need to do it explicitly. Output of
|
{
    "url": "https://api.github.com/repos/pydata/xarray/issues/2806/reactions",
    "total_count": 0,
    "+1": 0,
    "-1": 0,
    "laugh": 0,
    "hooray": 0,
    "confused": 0,
    "heart": 0,
    "rocket": 0,
    "eyes": 0
} |
not_planned | xarray 13221727 | issue | ||||||
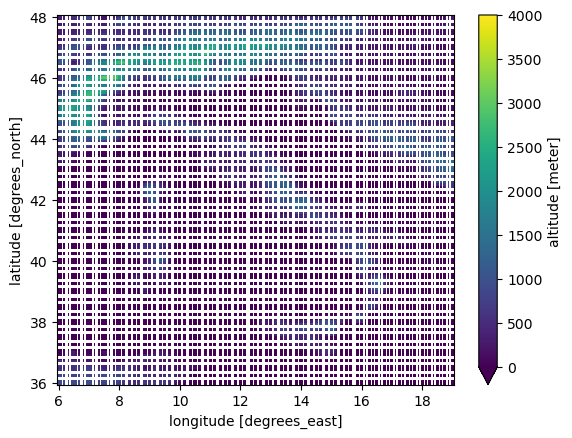
| 1381955373 | I_kwDOAMm_X85SXvct | 7065 | Merge wrongfully creating NaN | guidocioni 12760310 | closed | 0 | 9 | 2022-09-22T07:17:58Z | 2022-09-28T13:16:13Z | 2022-09-22T13:28:17Z | NONE | What happened?I'm trying to merge the following datasets, which have exactly the same coordinates and extents (not sure why it could cause any conflict).
After merging them, with
Here is a comparison of the altitude before and after the merge
If I try to create the
What did you expect to happen?Normal broadcasting rules should apply and the resulting array should not have NaNs. Minimal Complete Verifiable ExampleNo response MVCE confirmation
Relevant log outputNo response Anything else we need to know?No response Environment
INSTALLED VERSIONS
------------------
commit: None
python: 3.10.6 | packaged by conda-forge | (main, Aug 22 2022, 20:43:44) [Clang 13.0.1 ]
python-bits: 64
OS: Darwin
OS-release: 21.6.0
machine: x86_64
processor: i386
byteorder: little
LC_ALL: None
LANG: None
LOCALE: (None, 'UTF-8')
libhdf5: 1.12.2
libnetcdf: 4.8.1
xarray: 2022.6.0
pandas: 1.5.0
numpy: 1.22.4
scipy: 1.9.1
netCDF4: 1.6.1
pydap: None
h5netcdf: None
h5py: 3.7.0
Nio: None
zarr: 2.12.0
cftime: 1.6.2
nc_time_axis: None
PseudoNetCDF: None
rasterio: 1.3.2
cfgrib: 0.9.10.1
iris: None
bottleneck: 1.3.5
dask: 2022.9.1
distributed: 2022.9.1
matplotlib: 3.6.0
cartopy: 0.21.0
seaborn: 0.12.0
numbagg: None
fsspec: 2022.8.2
cupy: None
pint: 0.19.2
sparse: None
flox: None
numpy_groupies: None
setuptools: 65.3.0
pip: 21.3.1
conda: None
pytest: None
IPython: 8.5.0
sphinx: None
|
{
    "url": "https://api.github.com/repos/pydata/xarray/issues/7065/reactions",
    "total_count": 0,
    "+1": 0,
    "-1": 0,
    "laugh": 0,
    "hooray": 0,
    "confused": 0,
    "heart": 0,
    "rocket": 0,
    "eyes": 0
} |
completed | xarray 13221727 | issue | ||||||
| 1333650265 | I_kwDOAMm_X85PfeNZ | 6904 | `sel` behaving randomly when applying to a dataset with multiprocessing | guidocioni 12760310 | open | 0 | 12 | 2022-08-09T18:43:06Z | 2022-08-10T16:48:53Z | NONE | What happened?I have a script structured like this ```python def main(): global ds ds = xr.open_dataset(file) for point in points: compute(point) def compute(point): ds_point = ds.sel(lat=point['latitude'], lon=point['longitude'], method='nearest') print(ds_point.var.mean()) # do something with ds_point and other data... if name == "main": main() ``` This works as expected. However, if I try to parallelize
The results of the print are completely different from the serial example and they change every time that I run the script. it seems that the If I move the Is this supposed to happen? I really don't understand how. What did you expect to happen?The behaviour of Minimal Complete Verifiable ExampleNo response MVCE confirmation
Relevant log outputNo response Anything else we need to know?No response Environment
INSTALLED VERSIONS
------------------
commit: None
python: 3.8.13 | packaged by conda-forge | (default, Mar 25 2022, 06:04:10)
[GCC 10.3.0]
python-bits: 64
OS: Linux
OS-release: 3.10.0-229.1.2.el7.x86_64
machine: x86_64
processor: x86_64
byteorder: little
LC_ALL: None
LANG: en_US.utf8
LOCALE: ('en_US', 'UTF-8')
libhdf5: 1.10.6
libnetcdf: 4.7.4
xarray: 2022.3.0
pandas: 1.2.3
numpy: 1.20.3
scipy: 1.8.1
netCDF4: 1.5.6
pydap: None
h5netcdf: None
h5py: None
Nio: None
zarr: None
cftime: 1.6.1
nc_time_axis: None
PseudoNetCDF: None
rasterio: 1.2.1
cfgrib: None
iris: None
bottleneck: None
dask: 2022.7.1
distributed: 2022.7.1
matplotlib: 3.5.2
cartopy: 0.18.0
seaborn: 0.11.2
numbagg: None
fsspec: 2022.5.0
cupy: None
pint: 0.19.2
sparse: None
setuptools: 59.8.0
pip: 22.2
conda: 4.13.0
pytest: None
IPython: 8.4.0
sphinx: None
|
{
    "url": "https://api.github.com/repos/pydata/xarray/issues/6904/reactions",
    "total_count": 0,
    "+1": 0,
    "-1": 0,
    "laugh": 0,
    "hooray": 0,
    "confused": 0,
    "heart": 0,
    "rocket": 0,
    "eyes": 0
} |
xarray 13221727 | issue | ||||||||
| 1329754426 | I_kwDOAMm_X85PQnE6 | 6879 | `Dataset.where()` incorrectly applies mask and creates new dimensions | guidocioni 12760310 | closed | 0 | 3 | 2022-08-05T10:30:41Z | 2022-08-05T12:10:33Z | 2022-08-05T12:10:33Z | NONE | What happened?Suppose I have the following dataset
and a mask to apply
If I apply the mask to the dataset doing
then
This causes all sort of issues as the newly created array What did you expect to happen?The final result should apply
Minimal Complete Verifiable ExampleNo response MVCE confirmation
Relevant log outputNo response Anything else we need to know?No response Environment
INSTALLED VERSIONS
------------------
commit: None
python: 3.8.13 | packaged by conda-forge | (default, Mar 25 2022, 06:04:10)
[GCC 10.3.0]
python-bits: 64
OS: Linux
OS-release: 3.10.0-229.1.2.el7.x86_64
machine: x86_64
processor: x86_64
byteorder: little
LC_ALL: None
LANG: en_US.utf8
LOCALE: ('en_US', 'UTF-8')
libhdf5: 1.10.6
libnetcdf: 4.7.4
xarray: 2022.3.0
pandas: 1.2.3
numpy: 1.20.3
scipy: 1.8.1
netCDF4: 1.5.6
pydap: None
h5netcdf: None
h5py: None
Nio: None
zarr: None
cftime: 1.6.1
nc_time_axis: None
PseudoNetCDF: None
rasterio: 1.2.1
cfgrib: None
iris: None
bottleneck: None
dask: 2022.7.1
distributed: 2022.7.1
matplotlib: 3.5.2
cartopy: 0.18.0
seaborn: 0.11.2
numbagg: None
fsspec: 2022.5.0
cupy: None
pint: 0.19.2
sparse: None
setuptools: 59.8.0
pip: 22.2
conda: 4.13.0
pytest: None
IPython: 8.4.0
sphinx: None
|
{
    "url": "https://api.github.com/repos/pydata/xarray/issues/6879/reactions",
    "total_count": 0,
    "+1": 0,
    "-1": 0,
    "laugh": 0,
    "hooray": 0,
    "confused": 0,
    "heart": 0,
    "rocket": 0,
    "eyes": 0
} |
completed | xarray 13221727 | issue | ||||||
| 932444037 | MDU6SXNzdWU5MzI0NDQwMzc= | 5549 | Time is not correctly saved to disk netcdf | guidocioni 12760310 | open | 0 | 0 | 2021-06-29T10:00:36Z | 2021-06-29T10:00:36Z | NONE | What happened: When trying to write a dataset to netcdf file using the netcdf4 engine time is not saved correctly. What you expected to happen: Time to be saved correctly as in the original dataset. Minimal Complete Verifiable Example:
is giving me the warning
xarray Dataset
saved on disk (notice time values)
I cannot see anything special in the time array...is there a limitation because of the compression? Environment: Output of <tt>xr.show_versions()</tt>INSTALLED VERSIONS ------------------ commit: None python: 3.8.8 | packaged by conda-forge | (default, Feb 20 2021, 16:22:27) [GCC 9.3.0] python-bits: 64 OS: Linux OS-release: 3.10.0-229.1.2.el7.x86_64 machine: x86_64 processor: x86_64 byteorder: little LC_ALL: None LANG: en_US.utf8 LOCALE: en_US.UTF-8 libhdf5: 1.10.6 libnetcdf: 4.7.4 xarray: 0.17.0 pandas: 1.2.3 numpy: 1.20.1 scipy: 1.6.3 netCDF4: 1.5.6 pydap: None h5netcdf: None h5py: None Nio: None zarr: None cftime: 1.5.0 nc_time_axis: None PseudoNetCDF: None rasterio: 1.2.2 cfgrib: None iris: None bottleneck: None dask: None distributed: None matplotlib: 3.3.4 cartopy: 0.18.0 seaborn: 0.11.1 numbagg: None pint: 0.17 setuptools: 49.6.0.post20210108 pip: 21.1.1 conda: 4.10.2 pytest: None IPython: 7.21.0 sphinx: None |
{
    "url": "https://api.github.com/repos/pydata/xarray/issues/5549/reactions",
    "total_count": 0,
    "+1": 0,
    "-1": 0,
    "laugh": 0,
    "hooray": 0,
    "confused": 0,
    "heart": 0,
    "rocket": 0,
    "eyes": 0
} |
xarray 13221727 | issue |


Advanced export
JSON shape: default, array, newline-delimited, object
CREATE TABLE [issues] (
   [id] INTEGER PRIMARY KEY,
   [node_id] TEXT,
   [number] INTEGER,
   [title] TEXT,
   [user] INTEGER REFERENCES [users]([id]),
   [state] TEXT,
   [locked] INTEGER,
   [assignee] INTEGER REFERENCES [users]([id]),
   [milestone] INTEGER REFERENCES [milestones]([id]),
   [comments] INTEGER,
   [created_at] TEXT,
   [updated_at] TEXT,
   [closed_at] TEXT,
   [author_association] TEXT,
   [active_lock_reason] TEXT,
   [draft] INTEGER,
   [pull_request] TEXT,
   [body] TEXT,
   [reactions] TEXT,
   [performed_via_github_app] TEXT,
   [state_reason] TEXT,
   [repo] INTEGER REFERENCES [repos]([id]),
   [type] TEXT
);
CREATE INDEX [idx_issues_repo]
    ON [issues] ([repo]);
CREATE INDEX [idx_issues_milestone]
    ON [issues] ([milestone]);
CREATE INDEX [idx_issues_assignee]
    ON [issues] ([assignee]);
CREATE INDEX [idx_issues_user]
    ON [issues] ([user]);