issues: 98878609
This data as json
| id | node_id | number | title | user | state | locked | assignee | milestone | comments | created_at | updated_at | closed_at | author_association | active_lock_reason | draft | pull_request | body | reactions | performed_via_github_app | state_reason | repo | type |
|---|---|---|---|---|---|---|---|---|---|---|---|---|---|---|---|---|---|---|---|---|---|---|
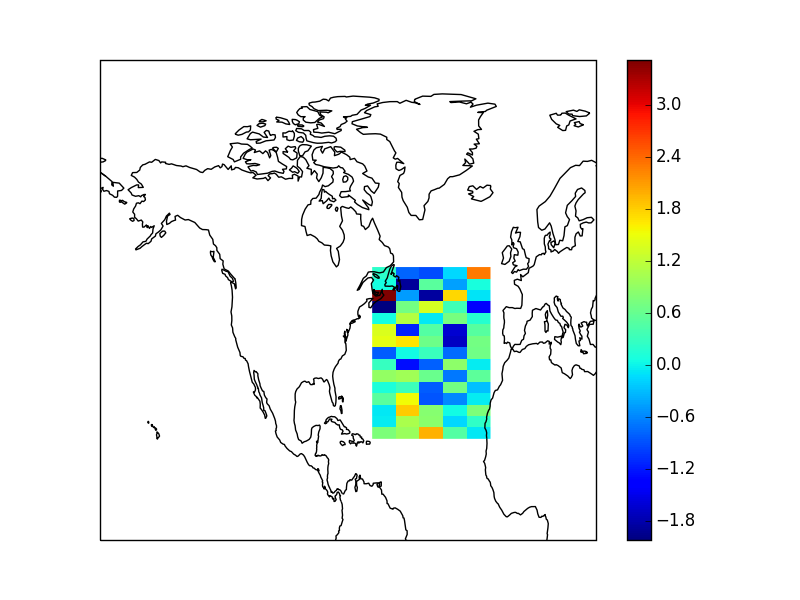
| 98878609 | MDU6SXNzdWU5ODg3ODYwOQ== | 513 | Problems with cartopy example | 499079 | closed | 0 | 0 | 2015-08-04T03:06:14Z | 2015-09-08T16:26:26Z | 2015-08-04T17:15:51Z | NONE | There are two problems with the current cartopy example: - The image array is plotted upside-down, with the data row that holds latitude 50° at the bottom, rather than the top, of the image. This isn't immediately obvious because of the random data. - The image isn't shown in a true map projection, even Plate Carrée, since the aspect ratio isn't held constant. Current image:
Same image with a true Plate Carrée projection:
(the default colormap has changed from jet as well, which is all to the good.) Both of these issues can be fixed by passing the arguments |
{
    "url": "https://api.github.com/repos/pydata/xarray/issues/513/reactions",
    "total_count": 0,
    "+1": 0,
    "-1": 0,
    "laugh": 0,
    "hooray": 0,
    "confused": 0,
    "heart": 0,
    "rocket": 0,
    "eyes": 0
} |
completed | 13221727 | issue |