issues: 1613054013
This data as json
| id | node_id | number | title | user | state | locked | assignee | milestone | comments | created_at | updated_at | closed_at | author_association | active_lock_reason | draft | pull_request | body | reactions | performed_via_github_app | state_reason | repo | type |
|---|---|---|---|---|---|---|---|---|---|---|---|---|---|---|---|---|---|---|---|---|---|---|
| 1613054013 | I_kwDOAMm_X85gJUA9 | 7593 | Plotting with time-zone-aware pd.Timestamp axis not possible | 25102059 | open | 0 | 6 | 2023-03-07T09:32:49Z | 2023-05-06T03:24:46Z | CONTRIBUTOR | What is your issue?When trying to use the plot-method on a DataArray that contains a time axis with time zone aware pandas Timestamps a TypeError is raised. As a minimal example:
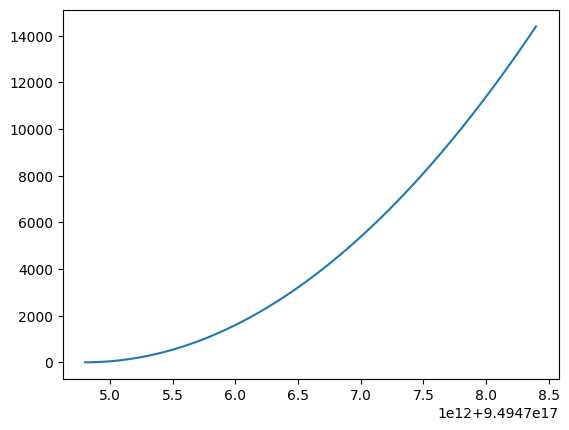
While matplotlib is capable of handling it. Not in a nice way, but at least without crashing:
I tried that the same result can be achieved, if in the method issuing the If there are no objections I would issue a PR extending the tuple. Related observations_ensure_plottable removalI found discussions on removing the PandasPandas itself is able to even plot the time stamps in a nice way. So, maybe in the long-term it might make sense to use these capabilities.
|
{
    "url": "https://api.github.com/repos/pydata/xarray/issues/7593/reactions",
    "total_count": 0,
    "+1": 0,
    "-1": 0,
    "laugh": 0,
    "hooray": 0,
    "confused": 0,
    "heart": 0,
    "rocket": 0,
    "eyes": 0
} |
13221727 | issue |