issues: 1332143835
This data as json
| id | node_id | number | title | user | state | locked | assignee | milestone | comments | created_at | updated_at | closed_at | author_association | active_lock_reason | draft | pull_request | body | reactions | performed_via_github_app | state_reason | repo | type |
|---|---|---|---|---|---|---|---|---|---|---|---|---|---|---|---|---|---|---|---|---|---|---|
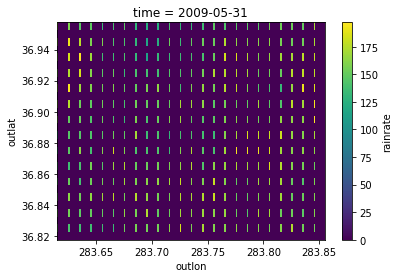
| 1332143835 | I_kwDOAMm_X85PZubb | 6892 | 2 Dimension Plot Producing Discontinuous Grid | 64621312 | closed | 0 | 1 | 2022-08-08T16:59:14Z | 2022-08-08T17:12:41Z | 2022-08-08T17:11:44Z | NONE | What is your issue?Problem: I'm expecting a plot that looks like the one here (Plotting-->Two Dimensions-->Simple Example) with a continuous grid, but instead I'm getting the plot below which has a discontinuous grid. This could be due to different spacing in the x and y dimensions (0.005 spacing in the Reprex:
|
{
    "url": "https://api.github.com/repos/pydata/xarray/issues/6892/reactions",
    "total_count": 0,
    "+1": 0,
    "-1": 0,
    "laugh": 0,
    "hooray": 0,
    "confused": 0,
    "heart": 0,
    "rocket": 0,
    "eyes": 0
} |
completed | 13221727 | issue |