id,node_id,number,title,user,state,locked,assignee,milestone,comments,created_at,updated_at,closed_at,author_association,active_lock_reason,draft,pull_request,body,reactions,performed_via_github_app,state_reason,repo,type
419945711,MDU6SXNzdWU0MTk5NDU3MTE=,2806,Dask arrays from `open_mfdataset` not loading when plotting inside a `multiprocessing` instance,12760310,closed,0,,,1,2019-03-12T11:54:44Z,2023-12-02T02:43:30Z,2023-12-02T02:43:30Z,NONE,,,,"#### Code Sample
Unfortunately I cannot include the original data, as it is quite large, but I can make an accessible dropbox folder if needed.
```python
debug = False
if not debug:
import matplotlib
matplotlib.use('Agg')
import matplotlib.pyplot as plt
import xarray as xr
import metpy.calc as mpcalc
from metpy.units import units
from glob import glob
import numpy as np
import pandas as pd
from multiprocessing import Pool
from functools import partial
import os
from utils import *
import sys
variable_name = 'cape_cin'
projections = ['de','it','nord']
def main():
""""""In the main function we basically read the files and prepare the variables to be plotted.
This is not included in utils.py as it can change from case to case.""""""
files = glob(input_file)
dset = xr.open_mfdataset(files)
# Only take hourly data
dset = dset.sel(time=pd.date_range(dset.time[0].values, dset.time[-1].values, freq='H'))
# Parse metadata for metpy
dset = dset.metpy.parse_cf()
# Select variable
cape = dset['CAPE_ML'].squeeze().load()
# Get coordinates
lon, lat = get_coordinates(dset)
lon2d, lat2d = np.meshgrid(lon, lat)
time = pd.to_datetime(dset.time.values)
cum_hour=np.array((time-time[0]) / pd.Timedelta('1 hour')).astype(""int"")
levels_cape = np.arange(250., 2000., 250.)
cmap = truncate_colormap(plt.get_cmap('gist_stern_r'), 0., 0.7)
for projection in projections:
fig = plt.figure(figsize=(figsize_x, figsize_y))
ax = plt.gca()
m, x, y =get_projection(lon2d, lat2d, projection, labels=True)
# All the arguments that need to be passed to the plotting function
args=dict(m=m, x=x, y=y, ax=ax, cmap=cmap,
cape=cape, levels_cape=levels_cape,
time=time, projection=projection, cum_hour=cum_hour)
print('Pre-processing finished, launching plotting scripts')
if debug:
plot_files(time[1:2], **args)
else:
# Parallelize the plotting by dividing into chunks and processes
dates = chunks(time, chunks_size)
plot_files_param=partial(plot_files, **args)
p = Pool(processes)
p.map(plot_files_param, dates)
def plot_files(dates, **args):
first = True
for date in dates:
# Find index in the original array to subset when plotting
i = np.argmin(np.abs(date - args['time']))
# Build the name of the output image
filename = subfolder_images[args['projection']]+'/'+variable_name+'_%s.png' % args['cum_hour']
# Do the plot
cs = args['ax'].contourf(args['x'], args['y'], args['cape'][i],
extend='both', cmap=args['cmap'],
levels=args['levels_cape'])
if first:
plt.colorbar(cs, orientation='horizontal', label='CAPE [J/kg]', pad=0.03, fraction=0.04)
if debug:
plt.show(block=True)
else:
plt.savefig(filename, **options_savefig)
remove_collections([cs, an_fc, an_var, an_run])
first = False
if __name__ == ""__main__"":
main()
```
#### Problem description
My task is to routinely plot output from weather models in an automatized way. The main driver script is written in 'bash' and calls different 'python' scripts at the same time.
Given that the input data is always dimensioned '(time, level, latitude, longitude)' and that I have to do one plot per timestep it seemed natural to me to use `multiprocessing` to split the load of different time-chunks over different processors. Since I also have to pass some parameters/variables I call the function to do the actual plotting `plot_files` using the `partial` constructor `plot_files_param=partial(plot_files, **args)`. This way I can then unpack all the needed parameters/variables in the function itself without needing to declare them as global variables. Note that this is fundamental as, to make everything fast, I only create most of the variables/instances once and then update them at every iteration.
This works fine if I load the input `netcdf` file with `open_dataset`, but instead if I use `open_mfdataset` (as in some case I have many files scattered in a folder) then I have to be careful in explicitly loading the arrays before passing them to the plotting function, otherwise the script will hang.
More specifically. if I remove the `.load()` statement from this line
```python
cape = dset['CAPE_ML'].squeeze().load()
```
then `cape` stays a dask array and gets passed as argument to `plot_files`. Then I was expecting the plot call to load it as array in memory before doing the plot, but this does not happen (I think) and then the script just hangs (does not post any error). Interestingly enough, if I use the option `debug = True`, which instead of parallelizing the plotting just plot 1 timestep and directly show the output, everything works fine, although the array passed is still a dask array. So, this is definitely something related to the use of the `partial` construct.
In theory I would like to keep the `.load()` usage as small as possible as data can be pretty huge and I only want to load it into memory when I have to plot it.
It may well be that my code is somehow malformed but as far as I know this should not be the expected behaviour. Please apologize if I'm doing something wrong; every suggestion is highly appreciated! Thought that I report the error as I found it to be non-expected behaviour.
#### Expected Output
Array should load into memory when plotting without the need to do it explicitly.
#### Output of ``xr.show_versions()``
INSTALLED VERSIONS
------------------
commit: None
python: 2.7.15 | packaged by conda-forge | (default, Nov 29 2018, 06:43:57)
[GCC 4.8.2 20140120 (Red Hat 4.8.2-15)]
python-bits: 64
OS: Linux
OS-release: 3.16.0-7-amd64
machine: x86_64
processor:
byteorder: little
LC_ALL: en_US.UTF-8
LANG: en_US.UTF-8
LOCALE: None.None
libhdf5: 1.10.3
libnetcdf: 4.6.1
xarray: 0.11.2
pandas: 0.23.4
numpy: 1.15.4
scipy: 1.2.0
netCDF4: 1.4.2
pydap: None
h5netcdf: None
h5py: 2.8.0
Nio: None
zarr: None
cftime: 1.0.2.1
PseudonetCDF: None
rasterio: None
cfgrib: 0.9.5.1
iris: None
bottleneck: None
cyordereddict: None
dask: 1.0.0
distributed: 1.25.0
matplotlib: 2.2.3
cartopy: 0.17.0
seaborn: 0.9.0
setuptools: 40.6.2
pip: 18.1
conda: None
pytest: None
IPython: 5.8.0
sphinx: None
","{""url"": ""https://api.github.com/repos/pydata/xarray/issues/2806/reactions"", ""total_count"": 0, ""+1"": 0, ""-1"": 0, ""laugh"": 0, ""hooray"": 0, ""confused"": 0, ""heart"": 0, ""rocket"": 0, ""eyes"": 0}",,not_planned,13221727,issue
1381955373,I_kwDOAMm_X85SXvct,7065,Merge wrongfully creating NaN,12760310,closed,0,,,9,2022-09-22T07:17:58Z,2022-09-28T13:16:13Z,2022-09-22T13:28:17Z,NONE,,,,"### What happened?
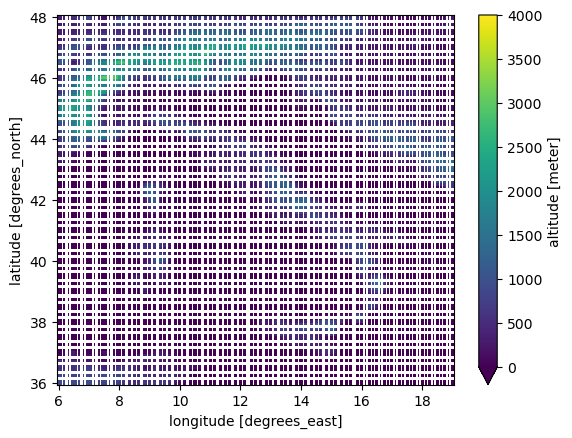
I'm trying to merge the following datasets, which have exactly the same coordinates and extents (not sure why it could cause any conflict).
![]()
![]() After merging them, with `xr.merge([ds, alt])` (the order does not matter), the resulting altitude has NaNs all over the place. I could tell that something wrong was going on because the merge took too long (about 30s, while it should be pretty much instantaneous given the dimensions).
After merging them, with `xr.merge([ds, alt])` (the order does not matter), the resulting altitude has NaNs all over the place. I could tell that something wrong was going on because the merge took too long (about 30s, while it should be pretty much instantaneous given the dimensions).
![]() Here is a comparison of the altitude before and after the merge

If I try to create the `DataArray` manually, that is
```python
ds['altitude'] = xr.DataArray(data=alt.altitude.values, dims=(""lat"",""lon""))
```
everythign works fine.
### What did you expect to happen?
Normal broadcasting rules should apply and the resulting array should not have NaNs.
### Minimal Complete Verifiable Example
_No response_
### MVCE confirmation
- [X] Minimal example — the example is as focused as reasonably possible to demonstrate the underlying issue in xarray.
- [ ] Complete example — the example is self-contained, including all data and the text of any traceback.
- [ ] Verifiable example — the example copy & pastes into an IPython prompt or [Binder notebook](https://mybinder.org/v2/gh/pydata/xarray/main?urlpath=lab/tree/doc/examples/blank_template.ipynb), returning the result.
- [ ] New issue — a search of GitHub Issues suggests this is not a duplicate.
### Relevant log output
_No response_
### Anything else we need to know?
_No response_
### Environment
Here is a comparison of the altitude before and after the merge


If I try to create the `DataArray` manually, that is
```python
ds['altitude'] = xr.DataArray(data=alt.altitude.values, dims=(""lat"",""lon""))
```
everythign works fine.
### What did you expect to happen?
Normal broadcasting rules should apply and the resulting array should not have NaNs.
### Minimal Complete Verifiable Example
_No response_
### MVCE confirmation
- [X] Minimal example — the example is as focused as reasonably possible to demonstrate the underlying issue in xarray.
- [ ] Complete example — the example is self-contained, including all data and the text of any traceback.
- [ ] Verifiable example — the example copy & pastes into an IPython prompt or [Binder notebook](https://mybinder.org/v2/gh/pydata/xarray/main?urlpath=lab/tree/doc/examples/blank_template.ipynb), returning the result.
- [ ] New issue — a search of GitHub Issues suggests this is not a duplicate.
### Relevant log output
_No response_
### Anything else we need to know?
_No response_
### Environment
INSTALLED VERSIONS
------------------
commit: None
python: 3.10.6 | packaged by conda-forge | (main, Aug 22 2022, 20:43:44) [Clang 13.0.1 ]
python-bits: 64
OS: Darwin
OS-release: 21.6.0
machine: x86_64
processor: i386
byteorder: little
LC_ALL: None
LANG: None
LOCALE: (None, 'UTF-8')
libhdf5: 1.12.2
libnetcdf: 4.8.1
xarray: 2022.6.0
pandas: 1.5.0
numpy: 1.22.4
scipy: 1.9.1
netCDF4: 1.6.1
pydap: None
h5netcdf: None
h5py: 3.7.0
Nio: None
zarr: 2.12.0
cftime: 1.6.2
nc_time_axis: None
PseudoNetCDF: None
rasterio: 1.3.2
cfgrib: 0.9.10.1
iris: None
bottleneck: 1.3.5
dask: 2022.9.1
distributed: 2022.9.1
matplotlib: 3.6.0
cartopy: 0.21.0
seaborn: 0.12.0
numbagg: None
fsspec: 2022.8.2
cupy: None
pint: 0.19.2
sparse: None
flox: None
numpy_groupies: None
setuptools: 65.3.0
pip: 21.3.1
conda: None
pytest: None
IPython: 8.5.0
sphinx: None
","{""url"": ""https://api.github.com/repos/pydata/xarray/issues/7065/reactions"", ""total_count"": 0, ""+1"": 0, ""-1"": 0, ""laugh"": 0, ""hooray"": 0, ""confused"": 0, ""heart"": 0, ""rocket"": 0, ""eyes"": 0}",,completed,13221727,issue
1329754426,I_kwDOAMm_X85PQnE6,6879,`Dataset.where()` incorrectly applies mask and creates new dimensions,12760310,closed,0,,,3,2022-08-05T10:30:41Z,2022-08-05T12:10:33Z,2022-08-05T12:10:33Z,NONE,,,,"### What happened?
Suppose I have the following dataset
```python
Dimensions: (lat: 468, lon: 520, n_stations_t_2m_min_anom: 930)
Coordinates:
* lon (lon) float64 6.012 6.037 6.062 ... 18.96 18.99
* lat (lat) float64 36.01 36.04 36.06 ... 47.66 47.69
Dimensions without coordinates: n_stations_t_2m_min_anom
Data variables:
t_2m_min_anom (lat, lon) float32 ...
t_2m_min_anom_stations (n_stations_t_2m_min_anom) float64 1.935 ... 0.8557
```
and a mask to apply
```python
array([[False, False, False, ..., False, False, False],
[False, False, False, ..., False, False, False],
[False, False, False, ..., False, False, False],
...,
[False, False, False, ..., False, False, False],
[False, False, False, ..., False, False, False],
[False, False, False, ..., False, False, False]])
Coordinates:
* lat (lat) float64 36.01 36.04 36.06 36.09 ... 47.61 47.64 47.66 47.69
* lon (lon) float64 6.012 6.037 6.062 6.087 ... 18.91 18.94 18.96 18.99
```
If I apply the mask to the dataset doing
```python
data = data.where(mask)
```
then `lat, lon` dimensions are also broadcasted to `t_2m_min_anom_stations`, which is a 1-D array that does NOT have these coordinates.
```python
Dimensions: (lat: 468, lon: 520, n_stations_t_2m_min_anom: 930)
Coordinates:
* lon (lon) float64 6.012 6.037 6.062 ... 18.96 18.99
* lat (lat) float64 36.01 36.04 36.06 ... 47.66 47.69
region int64 0
abbrevs
Dimensions: (lat: 468, lon: 520, n_stations_t_2m_min_anom: 930)
Coordinates:
* lon (lon) float64 6.012 6.037 6.062 ... 18.96 18.99
* lat (lat) float64 36.01 36.04 36.06 ... 47.66 47.69
region int64 0
abbrevs
INSTALLED VERSIONS
------------------
commit: None
python: 3.8.13 | packaged by conda-forge | (default, Mar 25 2022, 06:04:10)
[GCC 10.3.0]
python-bits: 64
OS: Linux
OS-release: 3.10.0-229.1.2.el7.x86_64
machine: x86_64
processor: x86_64
byteorder: little
LC_ALL: None
LANG: en_US.utf8
LOCALE: ('en_US', 'UTF-8')
libhdf5: 1.10.6
libnetcdf: 4.7.4
xarray: 2022.3.0
pandas: 1.2.3
numpy: 1.20.3
scipy: 1.8.1
netCDF4: 1.5.6
pydap: None
h5netcdf: None
h5py: None
Nio: None
zarr: None
cftime: 1.6.1
nc_time_axis: None
PseudoNetCDF: None
rasterio: 1.2.1
cfgrib: None
iris: None
bottleneck: None
dask: 2022.7.1
distributed: 2022.7.1
matplotlib: 3.5.2
cartopy: 0.18.0
seaborn: 0.11.2
numbagg: None
fsspec: 2022.5.0
cupy: None
pint: 0.19.2
sparse: None
setuptools: 59.8.0
pip: 22.2
conda: 4.13.0
pytest: None
IPython: 8.4.0
sphinx: None
","{""url"": ""https://api.github.com/repos/pydata/xarray/issues/6879/reactions"", ""total_count"": 0, ""+1"": 0, ""-1"": 0, ""laugh"": 0, ""hooray"": 0, ""confused"": 0, ""heart"": 0, ""rocket"": 0, ""eyes"": 0}",,completed,13221727,issue