issue_comments: 360939678
This data as json
| html_url | issue_url | id | node_id | user | created_at | updated_at | author_association | body | reactions | performed_via_github_app | issue |
|---|---|---|---|---|---|---|---|---|---|---|---|
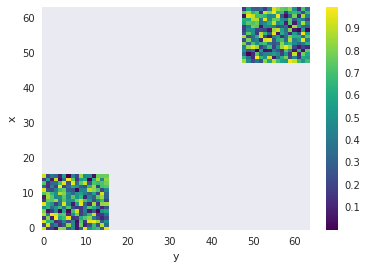
| https://github.com/pydata/xarray/issues/1862#issuecomment-360939678 | https://api.github.com/repos/pydata/xarray/issues/1862 | 360939678 | MDEyOklzc3VlQ29tbWVudDM2MDkzOTY3OA== | 1217238 | 2018-01-27T00:09:48Z | 2018-01-27T00:09:48Z | MEMBER | I'm not 100% sure if we're doing the right thing here or not :). The fundamental issue here is that your coordinates are not evenly spaced: ```
Notice the jump from 15 to 48. Without coordinate values in between, what should xarray assume for the intermediate values? Here we seem to be treating the function as piece-wise constant. Probably the simplest way to fix this is to start with an all NaN array of the appropriate size. This yields a sensible looking plot:
|
{
    "total_count": 0,
    "+1": 0,
    "-1": 0,
    "laugh": 0,
    "hooray": 0,
    "confused": 0,
    "heart": 0,
    "rocket": 0,
    "eyes": 0
} |
292054887 |