html_url,issue_url,id,node_id,user,created_at,updated_at,author_association,body,reactions,performed_via_github_app,issue
https://github.com/pydata/xarray/issues/1862#issuecomment-361298500,https://api.github.com/repos/pydata/xarray/issues/1862,361298500,MDEyOklzc3VlQ29tbWVudDM2MTI5ODUwMA==,1217238,2018-01-29T16:18:49Z,2018-01-29T16:18:49Z,MEMBER,"> I think the behavior makes sense in 1d (pandas does the same linear interpolation I think)
I'm not so sure it makes sense in 1D, either. Most of the time I've wished that large gaps were replaced with empty gaps. I've learned to be suspicious of long straight lines.
One option would be to add a `max_spacing` argument to `plot()` that indicates a maximum ""valid"" spacing to plot continuously over. If a gap is larger than the spacing, then it would plotted empty instead.
Potentially we could even default to some heuristic choice for `max_spacing`, but I'm not sure exactly what that heuristic would be.
I'm also not entirely sure how to implement `max_spacing` for pcolormesh, contour or line plots. I suspect it would be impossible to do for imshow (but that's OK, imshow is only for completely regular data).","{""total_count"": 0, ""+1"": 0, ""-1"": 0, ""laugh"": 0, ""hooray"": 0, ""confused"": 0, ""heart"": 0, ""rocket"": 0, ""eyes"": 0}",,292054887
https://github.com/pydata/xarray/issues/1862#issuecomment-360939678,https://api.github.com/repos/pydata/xarray/issues/1862,360939678,MDEyOklzc3VlQ29tbWVudDM2MDkzOTY3OA==,1217238,2018-01-27T00:09:48Z,2018-01-27T00:09:48Z,MEMBER,"I'm not 100% sure if we're doing the right thing here or not :).
The fundamental issue here is that your coordinates are not evenly spaced:
```
>>> xrAB
array([[ 0.805096, 0.339439, 0.889917, ..., nan, nan, nan],
[ 0.796546, 0.465788, 0.022211, ..., nan, nan, nan],
[ 0.075146, 0.261747, 0.029072, ..., nan, nan, nan],
...,
[ nan, nan, nan, ..., 0.297032, 0.707947, 0.617284],
[ nan, nan, nan, ..., 0.673249, 0.507685, 0.807462],
[ nan, nan, nan, ..., 0.68973 , 0.786864, 0.04618 ]])
Coordinates:
* y (y) int64 0 1 2 3 4 5 6 7 8 9 10 11 12 13 14 15 48 49 50 51 52 ...
* x (x) int64 0 1 2 3 4 5 6 7 8 9 10 11 12 13 14 15 48 49 50 51 52 ...
```
Notice the jump from 15 to 48. Without coordinate values in between, what should xarray assume for the intermediate values? Here we seem to be treating the function as piece-wise constant.
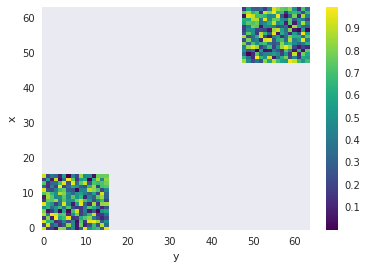
Probably the simplest way to fix this is to start with an all NaN array of the appropriate size. This yields a sensible looking plot:
```python
empty = xr.DataArray(np.full((N, N), np.nan), [('x', x), ('y', y)])
xrAB = empty.combine_first(xrA).combine_first(xrB)
xrAB.plot()
```
","{""total_count"": 0, ""+1"": 0, ""-1"": 0, ""laugh"": 0, ""hooray"": 0, ""confused"": 0, ""heart"": 0, ""rocket"": 0, ""eyes"": 0}",,292054887